Figure 4.

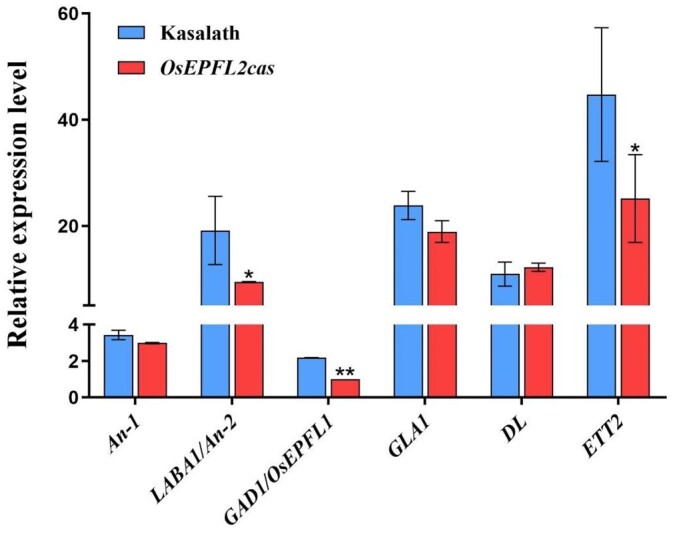
The expression pattern of the awn-related genes in Kasalath and OsEPFL2cas. Values are given as mean ± sd, n = 3, *P < 0.05; compared with the Kasalath by Student’s t test.

The expression pattern of the awn-related genes in Kasalath and OsEPFL2cas. Values are given as mean ± sd, n = 3, *P < 0.05; compared with the Kasalath by Student’s t test.