Figure 1.

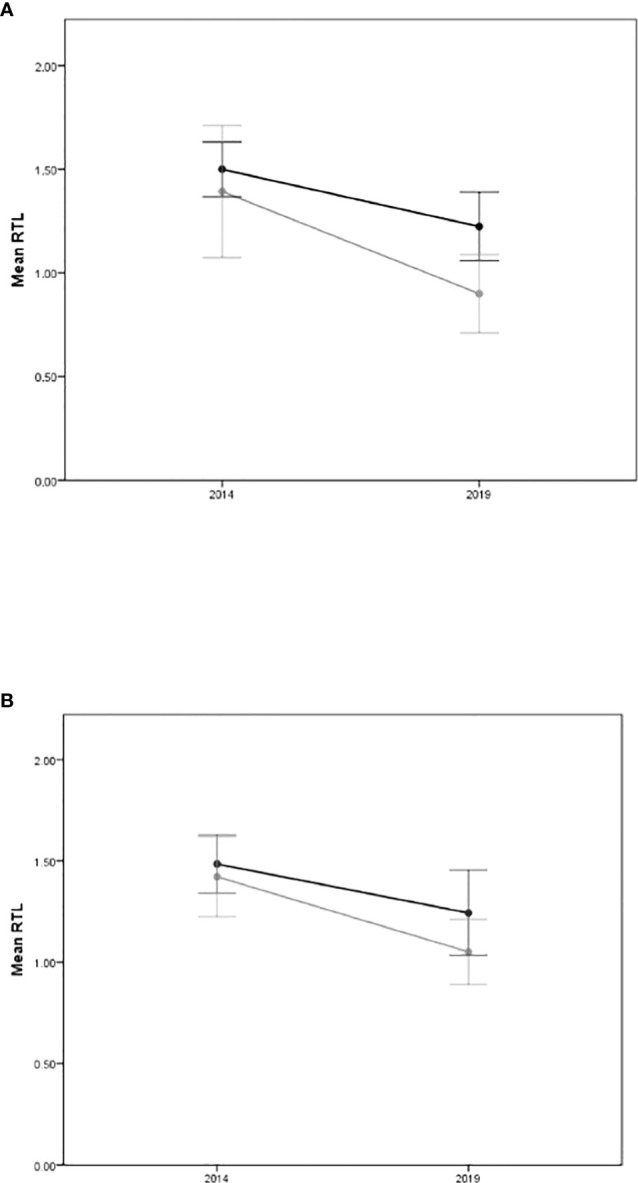
Mean RTL with 95% confidence intervals at baseline (2014) and at follow up (2019) for (A) definite diabetes status (Yes=grey line/No=dark line), and (B) C-Peptide levels (above the mean=grey line/below the mean=dark line).

Mean RTL with 95% confidence intervals at baseline (2014) and at follow up (2019) for (A) definite diabetes status (Yes=grey line/No=dark line), and (B) C-Peptide levels (above the mean=grey line/below the mean=dark line).