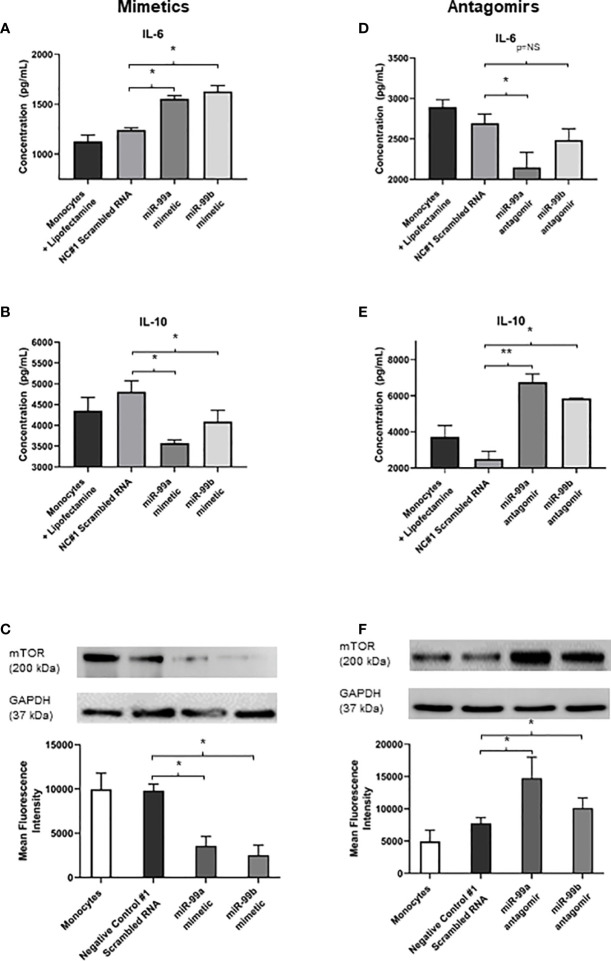
Figure 5.
Exosomal miR-99a and miR-99b drives the proinflammatory response in monocytes by downregulating mTOR following S. aureus infection (A, B) IL-6 and IL-10 expression in monocytes treated with miR-99a/b mimetics following a 24 hour S. aureus infection was determined by ELISA. Monocytes treated with lipofectamine 3000, and negative control scrambled RNA were considered negative controls, where neither group showed significant differences in cytokine levels. Monocytes transfected with miR-99a and miR-99b mimetics resulted in a significant increase to IL-6 levels, which also observed a significant decrease in IL-10 expression. (C) Total mTOR expression in monocytes treated with miR-99a/b mimetics in the presence of a 24 hour S. aureus infection was determined by western blot and densitometry analyses. GAPDH was used as a loading control. Transfection of either the miR-99a or miR-99b mimetic caused a significant reduction in mTOR production. (D, E) MiR-99a and miR-99b antagomirs were transfected into monocytes in the presence of S. aureus infection. IL-6 and IL-10 levels were assessed using ELISA. miR-99a antagomirs resulted in significant decrease to IL-6 production yet miR-99b antagomirs maintained IL-6 at physiological levels compared to negative controls. (D) Knockdown of miR-99a and miR-99b using antagomirs resulted in a significant increase in IL-10 production relative to negative control scrambled RNA. (E), (F) Total mTOR expression of monocytes treated with miR-99a/b antagomirs following a 24 hour S. aureus infection was determined by western blot and densitometry analyses. Both antagomirs resulted in a significant increase in mTOR levels relative to the negative controls. Comparatively, IL-6 and IL-10 production directly correlated with the changes in mTOR activity. Data is represented as mean ± SEM (n=6 western blot; n=4 ELISA; *p<0.05). NC, Negative control. **P<0.01, NS, not significant.

