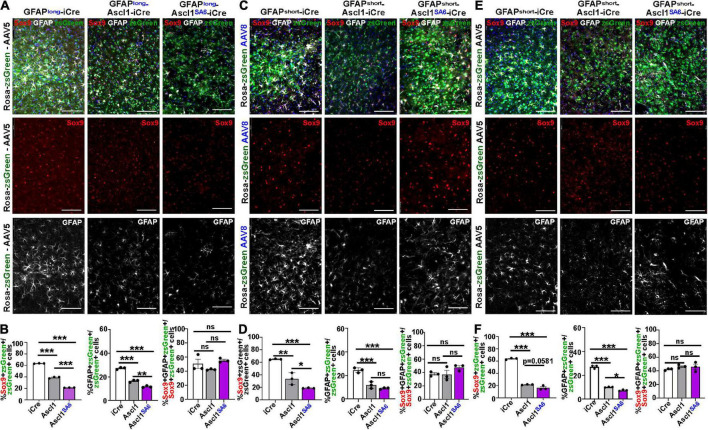
FIGURE 5.
Ascl1SA6 more efficiently represses astrocytic markers Sox9 and GFAP in transduced cortical cells compared to Ascl1. (A) Rosa-zsGreen cortex transduced with AAV5-GFAPlong-iCre, AAV5-GFAPlong-Ascl1-t2a-iCre, and AAV5-GFAPlong-Ascl1SA6-t2a-iCre at 21 days post-transduction, showing zsGreen epifluorescence, Sox9 (red) and GFAP (white) expression in merged and separate channels. Blue is a DAPI counterstain. (B) Quantification of the percentage of zsGreen+ cells that co-express Sox9 or GFAP, and the percentage of zsGreen+Sox9+ cells that co-express GFAP. (C) Rosa-zsGreen cortex transduced with AAV5-GFAPshort-iCre, AAV5-GFAPshort-Ascl1-t2a-iCre, and AAV5-GFAPshort-Ascl1SA6-t2a-iCre at 21 days post-transduction, showing zsGreen epifluorescence, Sox9 (red) and GFAP (white) expression in merged and separate channels. Blue is a DAPI counterstain. (D) Quantification of the percentage of zsGreen+ cells that co-express Sox9 or GFAP, and the percentage of zsGreen+Sox9+ cells that co-express GFAP. (E) Rosa-zsGreen cortex transduced with AAV8-GFAPshort-iCre, AAV8-GFAPshort-Ascl1-t2a-iCre, and AAV8-GFAPshort-Ascl1SA6-t2a-iCre at 21 days post-transduction, showing zsGreen epifluorescence, Sox9 (red) and GFAP (white) expression in merged and separate channels. Blue is a DAPI counterstain. (F) Quantification of the percentage of zsGreen+ cells that co-express Sox9 or GFAP, and the percentage of zsGreen+Sox9+ cells that co-express GFAP. Scale bars = 100 μm. Significance was defined as p-values less than 0.05 and denoted as follows: ns, not significant, <0.05 *, <0.01 **, <0.001 ***.

