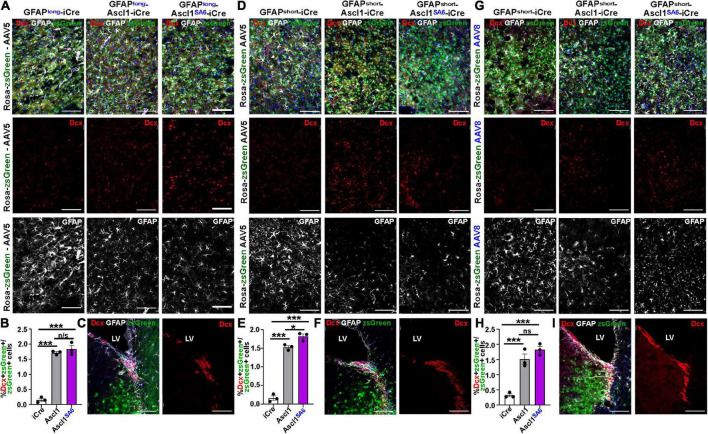
FIGURE 6.
Limited induction of Dcx expression in GFAP+ transduced astrocytes by Ascl1 and Ascl1SA6. (A–C) Rosa-zsGreen cortex transduced with AAV5-GFAPlong-iCre, AAV5-GFAPlong-Ascl1-t2a-iCre, and AAV5-GFAPlong-Ascl1SA6-t2a-iCre at 21 days post-transduction, showing zsGreen epifluorescence, Dcx (red) and GFAP (white) expression in the parenchyma of the motor cortex (A) or in the ventricular-subventricular zone (V-SVZ) (C). Blue is DAPI counterstain. (B) Quantification of the percentage of zsGreen+ cells that co-express Dcx. (D–F) Rosa-zsGreen cortex transduced with AAV5-GFAPshort-iCre, AAV5-GFAPshort-Ascl1-t2a-iCre, and AAV5-GFAPshort-Ascl1SA6-t2a-iCre at 21 days post-transduction, showing zsGreen epifluorescence, Dcx (red) and GFAP (white) expression in the parenchyma of the motor cortex (D) or in the ventricular-subventricular zone (V-SVZ) (F). Blue is DAPI counterstain. Quantification of the percentage of zsGreen+ cells that co-express Dcx (E). (G–I) Rosa-zsGreen cortex transduced with AAV8-GFAPshort-iCre, AAV8-GFAPshort-Ascl1-t2a-iCre, and AAV8-GFAPshort-Ascl1SA6-t2a-iCre at 21 days post-transduction, showing zsGreen epifluorescence, Dcx (red) and GFAP (white) expression in the parenchyma of the motor cortex (G) or in the ventricular-subventricular zone (V-SVZ) (I). Blue is DAPI counterstain. Quantification of the percentage of zsGreen+ cells that co-express Dcx (H). Scale bars = 100 μm. LV, lateral ventricle. Significance was defined as p-values less than 0.05 and denoted as follows: ns, not significant, <0.05 *, <0.01 **, <0.001 ***.

