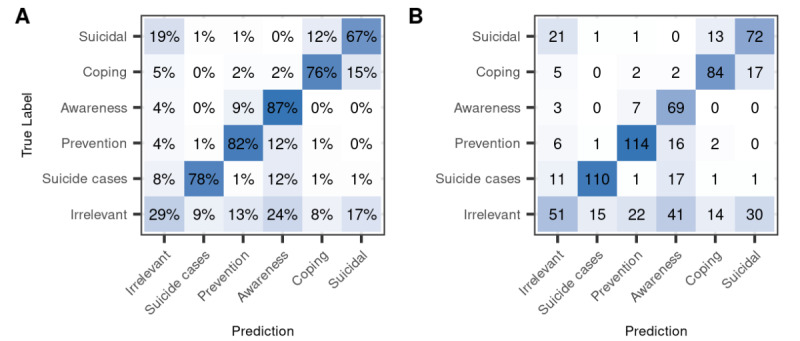
Figure 4.

Confusion matrix of true and predicted labels in the reliability data set. (A) percentages and (B) count of tweets per true and predicted category. The diagonal from bottom left to top right represents correct predictions. True labels are labels by coder 1, and predicted labels are by Bidirectional Encoder Representations from Transformers (BERT).
