Figure 5.

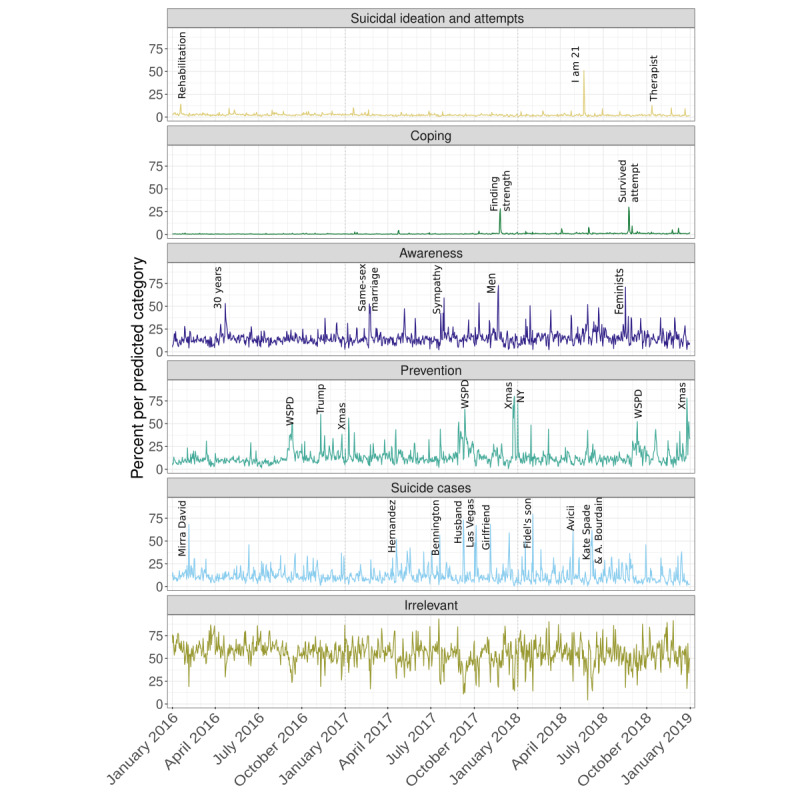
Daily percent of tweets per predicted category in the predictions data set (n=7.15 million). The daily value subsumes original and retweets per category. Key words for event peaks are explained in the main text.

Daily percent of tweets per predicted category in the predictions data set (n=7.15 million). The daily value subsumes original and retweets per category. Key words for event peaks are explained in the main text.