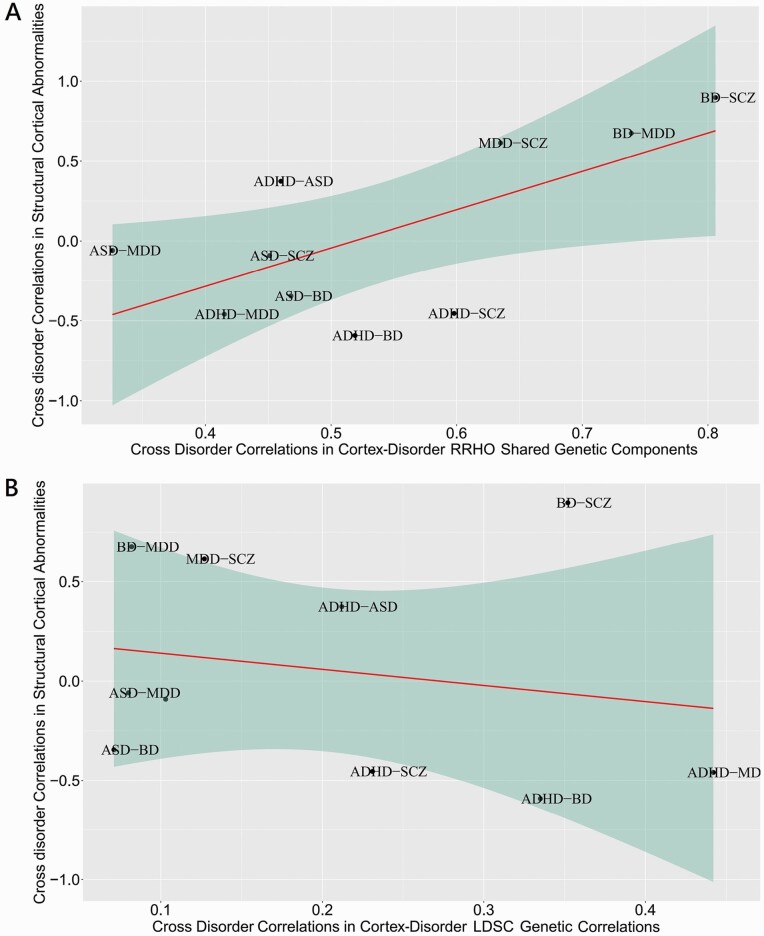
Fig. 2.
Scatter plot of the pairwise correlation of cross-disorder similarity in CS-MPD shared genetic components and genetic correlations with the corresponding structural cortical correlations across major psychiatric disorders. (A) Cross-disorder correlations in CS-MPD shared genetic components computed by RRHO analyses on the horizontal axis against the cross-disorder correlations of structural cortical abnormalities on the vertical axis, linear regression line with 95% confidence bands (red line, r = 0.668; Pearson p = 0.035). (B) Cross-disorder correlations in CS-MPD in genetic correlations (rg) computed by LDSC analyses on the horizontal axis against the cross-disorder correlations of structural cortical abnormalities displayed on the vertical axis, linear regression line with 95% confidence bands (red line, r = 0.200; Pearson p = 0.580). Each dot represents a pairwise disorder correlation.

