
Extended Data Fig. 4. Survival analysis comparison of piperacillin/tazobactam compared to cefepime exposure in non-Hodgkin lymphoma patients treated with CD19 CAR T cells.
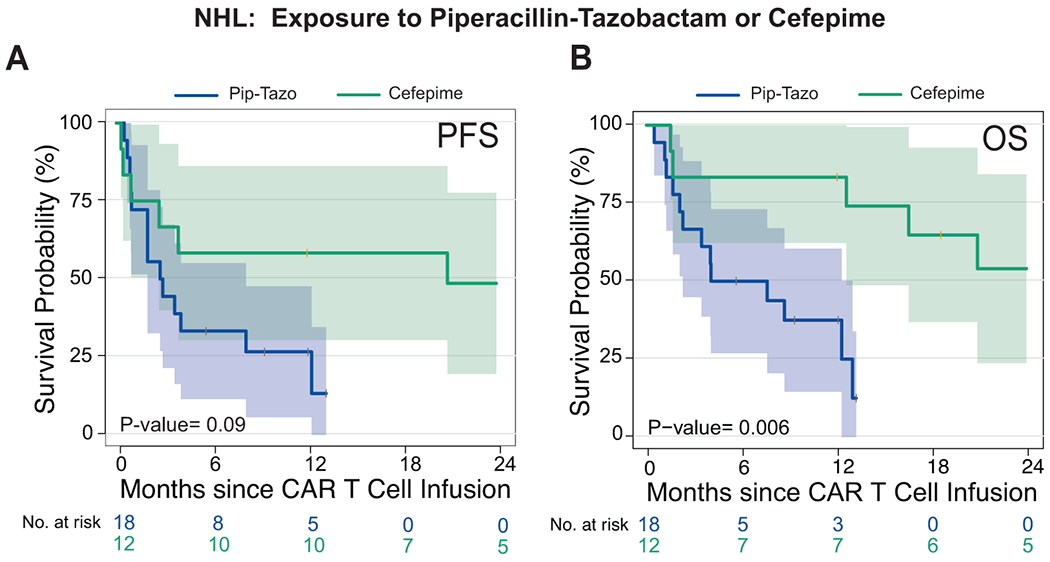
(A and B) Kaplan-Meier curves of (A) progression-free survival (PFS) and (B) overall survival (OS) by log-rank test. Data shows patients from the combined NHL population treated with piperacillin/tazobactam or cefepime in the 4 weeks before CD19 CAR T cell infusion. The dark blue line is the estimated Kaplan-Meier survival probability for patients exposed to piperacillin/tazobactam (n= 18) and the dark green line is the estimated probability for patients exposed to cefepime (n= 12). The shading is the estimated pointwise 95% confidence interval, and the tick marks indicate censored events. P values are shown (log-rank test). P values are shown (log-rank analysis). The p-values are not stratified by Center.
Abbreviations: NHL: non-Hodgkin lymphoma; p: p-value