
Fig. 10.
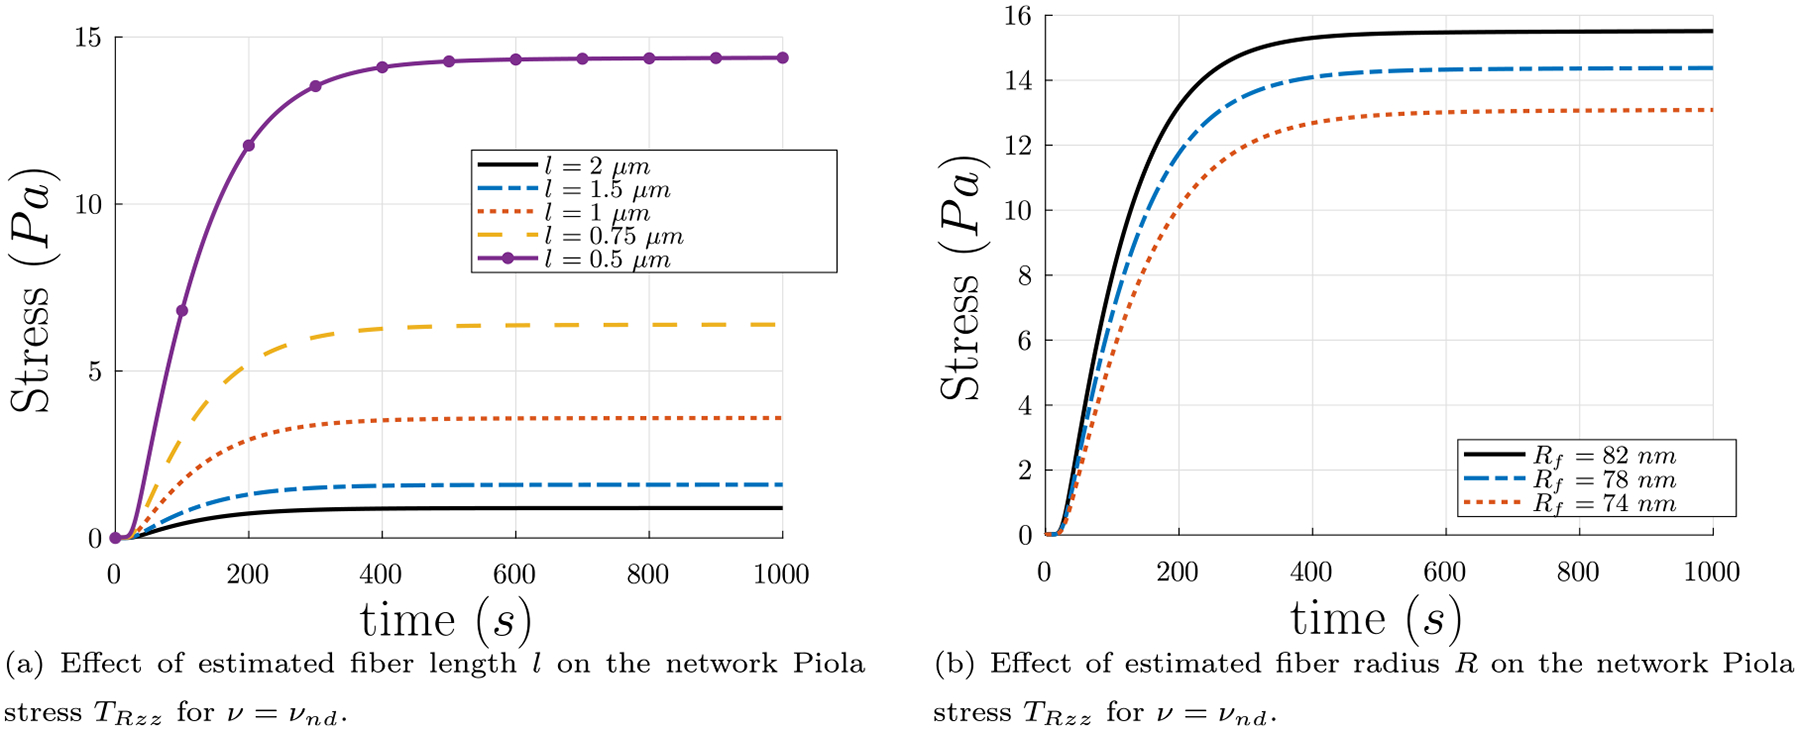
(a) Effect of estimated fiber length l on the network Piola stress TRzz using five values of l from the most likely range of l from the experimental probability distribution found in Kim et al. (2014), as discussed in Section 4.4. These plots assume that l remains fixed as solid volume fraction ϕs evolves with time. (b) Network Piola stress TRzz vs. polymerization time t for constant fiber length l = 0.5 μm, for different final values of fiber radius Rf. Thicker fibers contribute more network Piola stress TRzz.