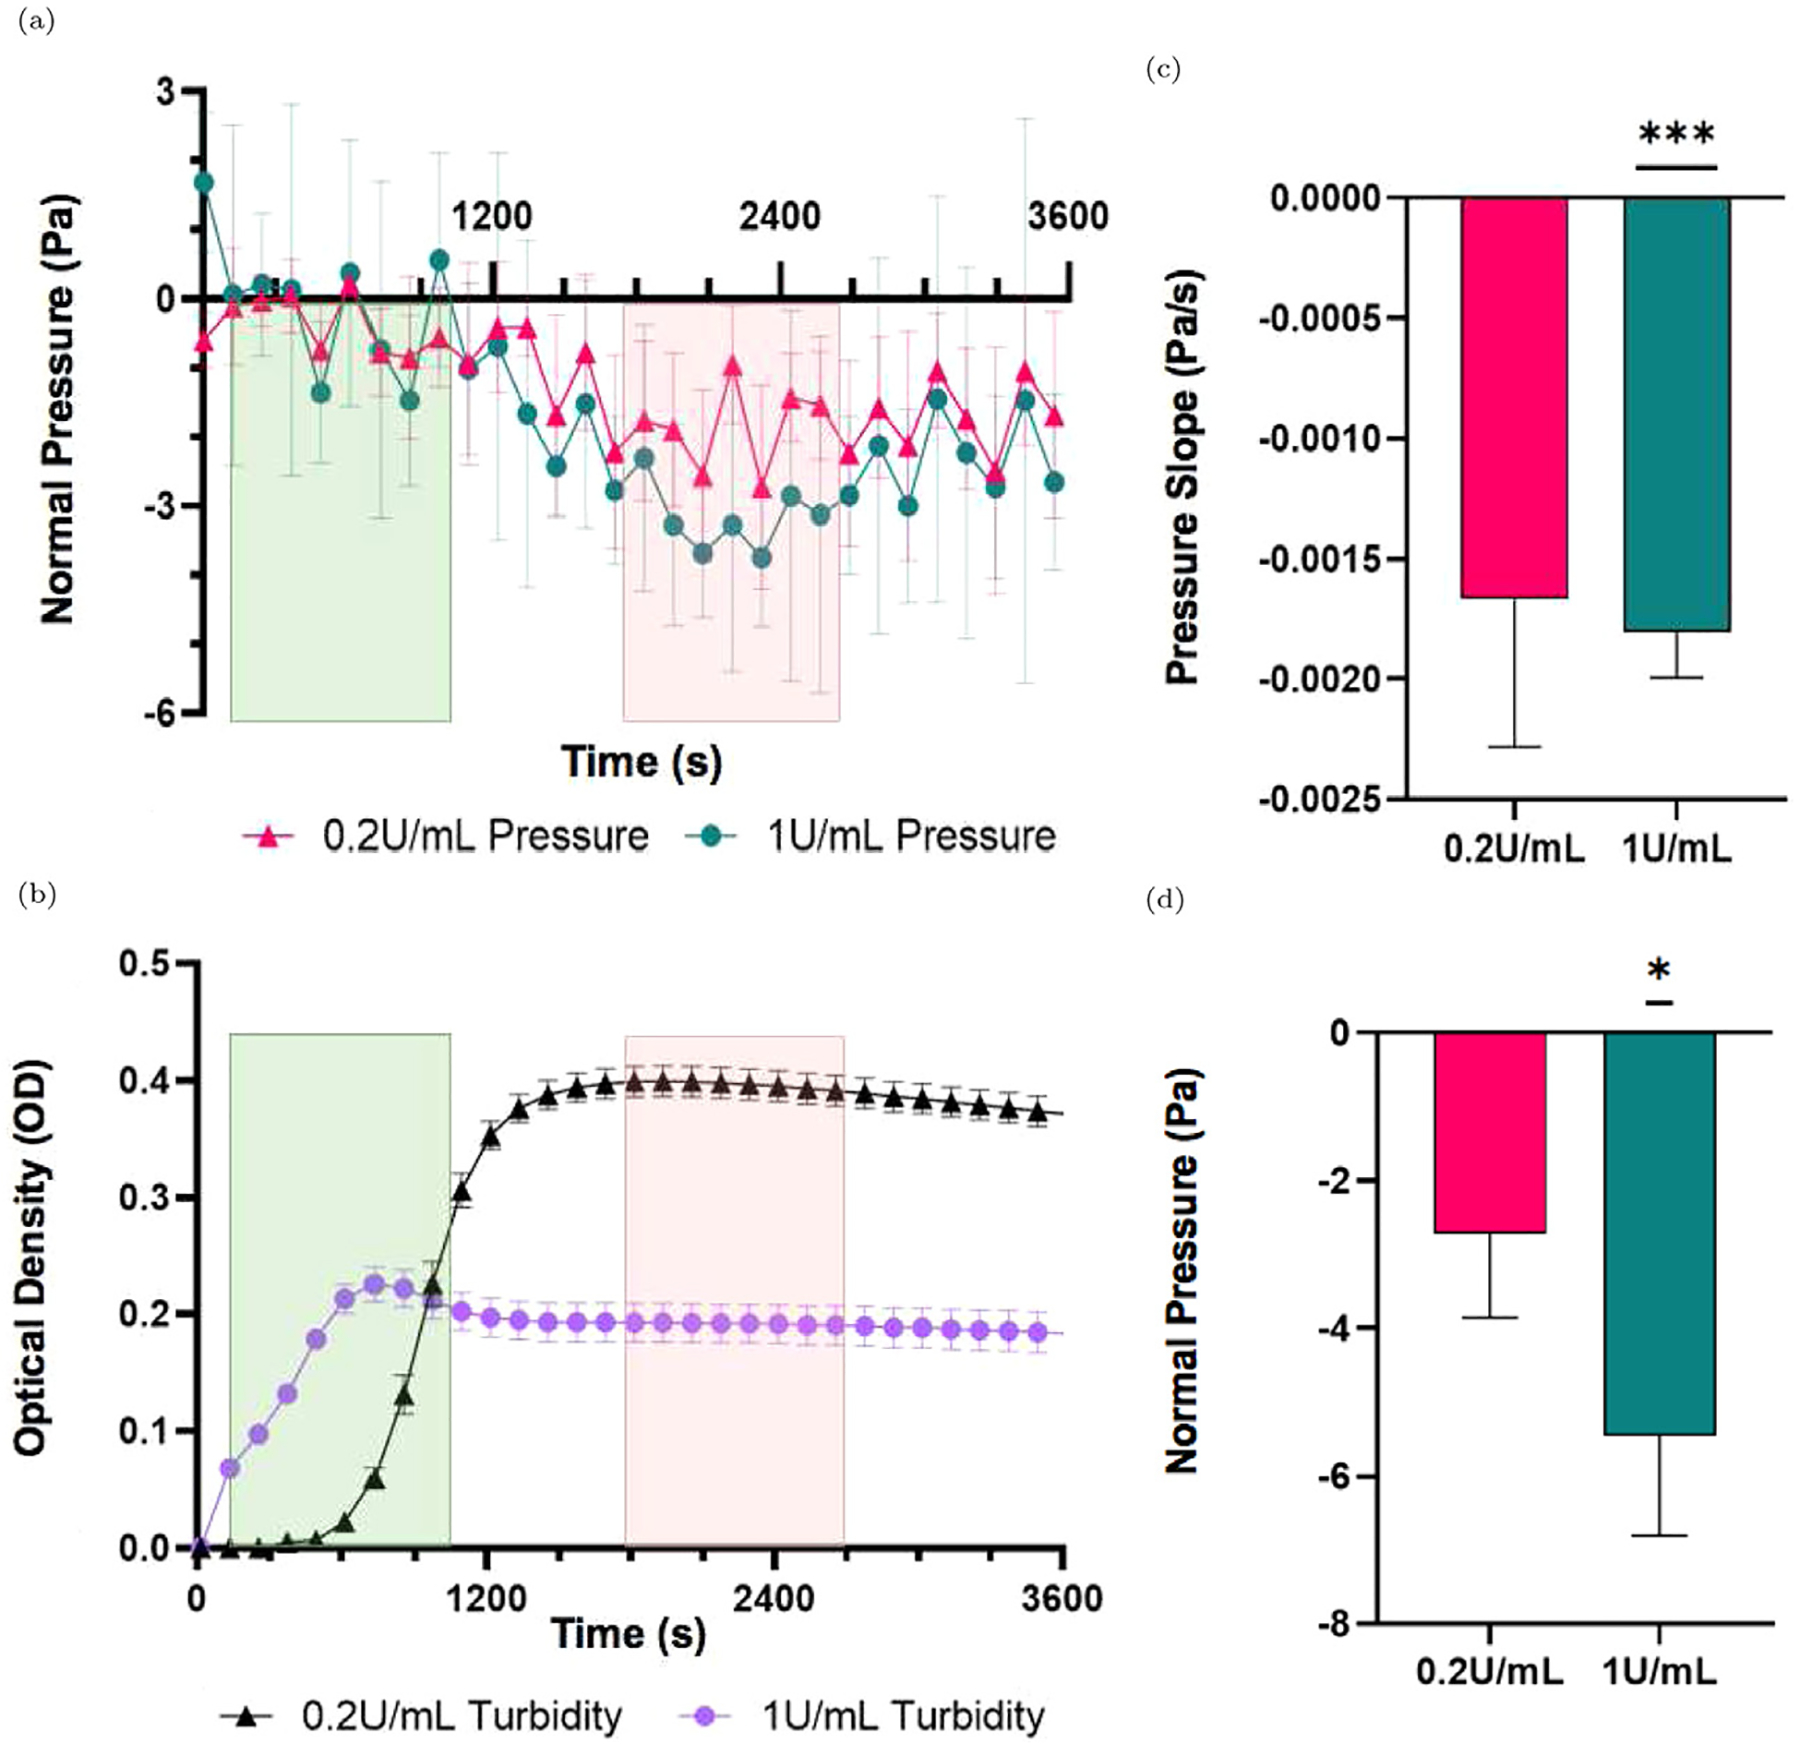
Fig. 2.

(a) Average normal pressure for 0.2 U/mL thrombin (pink, triangles) and 1 U/mL thrombin samples (teal, circles) profile in plasma samples after activation of clotting. Green shaded regions on the left indicate the range of time where first order derivatives were negative, indicating decreasing normal pressure. Red shaded regions on the right indicate where the first order derivative crosses the x axis indicating a plateau of normal pressure across each sample. (b) Average optical density measurements of 0.2 U/mL thrombin (black, triangles) and 1 U/mL thrombin (purple, circles) samples. Green and red ranges indicate the same as in (a). (c) Comparison of the slope of normal pressure in clotting plasma after normalization to unclotted plasma, as negative normal pressure is generated in samples activated with 0.2 U/mL (pink, left) and 1 U/mL (teal, right) thrombin. (d) Comparison of the change in normal pressure in clotting plasma after normalization to unclotted plasma, as negative normal pressure is generated in the samples. All data are represented as mean ± standard error of the mean unless otherwise noted. Subfigures (c) and (d) show comparison to the unclotted plasma slope and pressure at 0 Pa/s and 0 Pa respectively. *p ≤ 0.05, ***p < 0.001, and lack of significant differences between samples is indicated by no bar above the samples graphed. Analysis was completed using a one sample t-test relative to a theoretical 0 value, as the samples were normalized to the unclotted control.
