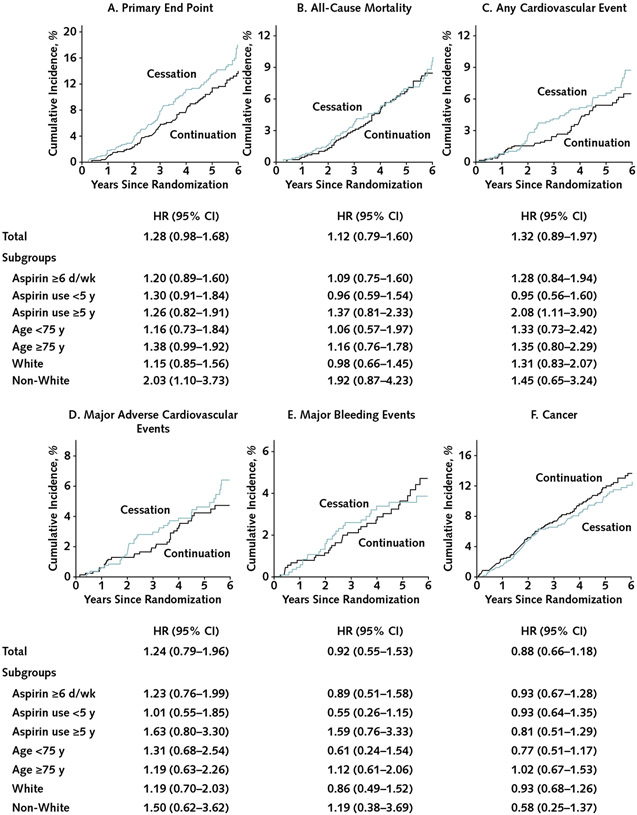
Figure. Cumulative incidence of outcomes compared between randomly assigned groups in all participants taking regular aspirin before trial entry and in subgroups by duration of use, race, and age at baseline.
HR= hazard ratio for cessation versus continuation. A–B. Kaplan–Meier failure function was applied to present cumulative incidence of the (A) primary end point and (B) all-cause mortality. C–F. The plots were constructed from the cumulative incidence predicted on the basis of separate models in the aspirin groups (cessation, n = 1841; continuation, n = 873), taking into account competing risk of non-end point death for: (C) any cardiovascular event (a composite of coronary heart disease death, nonfatal myocardial infarction, stroke, noncoronary cardiac or vascular death, or hospitalization for heart failure), (D) major adverse cardiovascular events (a composite of coronary heart disease death, nonfatal myocardial infarction, or ischemic stroke), (E) major bleeding events, and (F) incident cancer. The graphs were truncated at year 6 because only 2 participants reached year 7. All end points were analyzed as time to first event satisfying the end point definition. Overall, 116 participants (13.8%) in the cessation group and 97 (11.1%) in the continuation group experienced the primary end point (incidence rate, 29.8 vs. 23.4 per 1000 person-years); 64 versus 60 participants, respectively, experienced all-cause death (incidence rate, 7.6 vs. 6.9 per 1000 person-years); 55 versus 44 experienced a cardiovascular event (6.5 vs. 5.0 per 1000 person-years); 40 versus 34 experienced a major adverse cardiovascular event (4.8 vs. 3.9 per 1000 person-years); 28 versus 32 experienced major bleeding (3.3 vs. 3.7 per 1000 person-years); and 84 versus 100 experienced incident cancer (10.0 vs. 11.5 per 1000 person-years).

