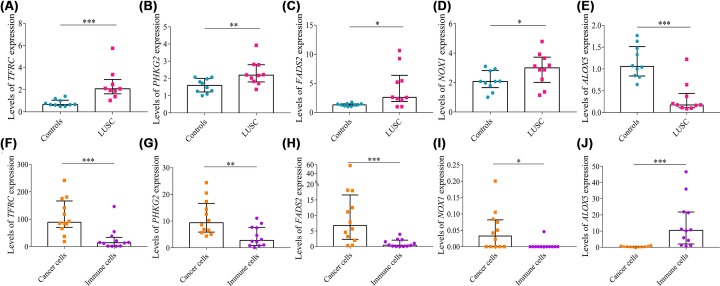
Figure 11. Real-time PCR and single cell RNA sequencing analysis.
Levels of (A) TFRC, (B) PHKG2, (C) FADS2, (D) NOX1, and (E) ALOX5 relative expression in lung tissues using real-time PCR. Relative expression levels of (F) TFRC, (G) PHKG2, (H) FADS2, (I) NOX1, and (J) ALOX5 between cancer cells and immune cells using single cell RNA sequencing analysis. Data were expressed as median (interquartile range); *P<0.05, **P<0.01, ***P<0.001.

