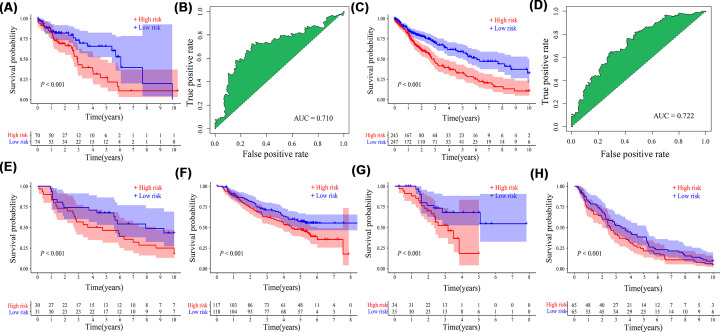
Figure 5. Validation of the prognostic signature.
Kaplan–Meier survival curve and receiver operating characteristic curve in (A,B) the TCGA test cohorts and (C,D) the entire TCGA cohorts. Kaplan–Meier survival curve in (E) GSE30219, (F) GSE157010, (G) GSE73403, and (H) GSE4573 datasets; AUC, area under the ROC curve.

