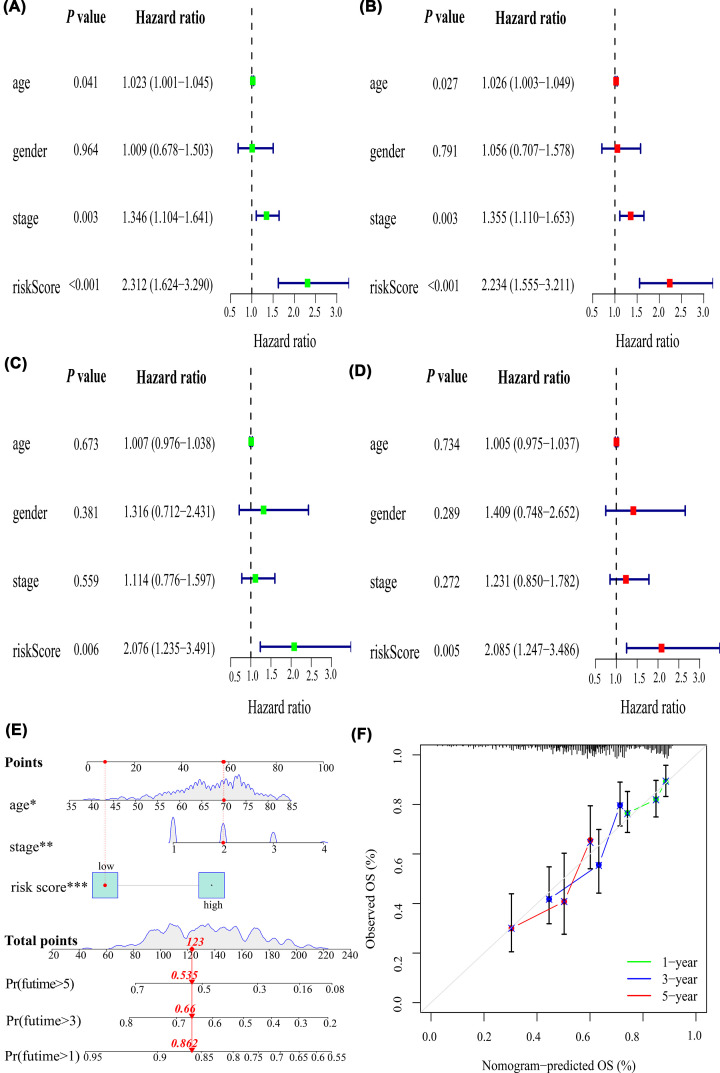
Figure 6. Correlations of the risk score with clinicopathological characteristics and construction of a nomogram and calibration plots.
Univariable and multivariate Cox regression analysis in the (A,B) training cohorts and (C,D) test cohorts. (E) Nomogram to predict OS at 1, 3, and 5 years. (F) Calibration plots of the nomogram. OS: overall survival; *P<0.05, **P<0.01, ***P<0.001.

