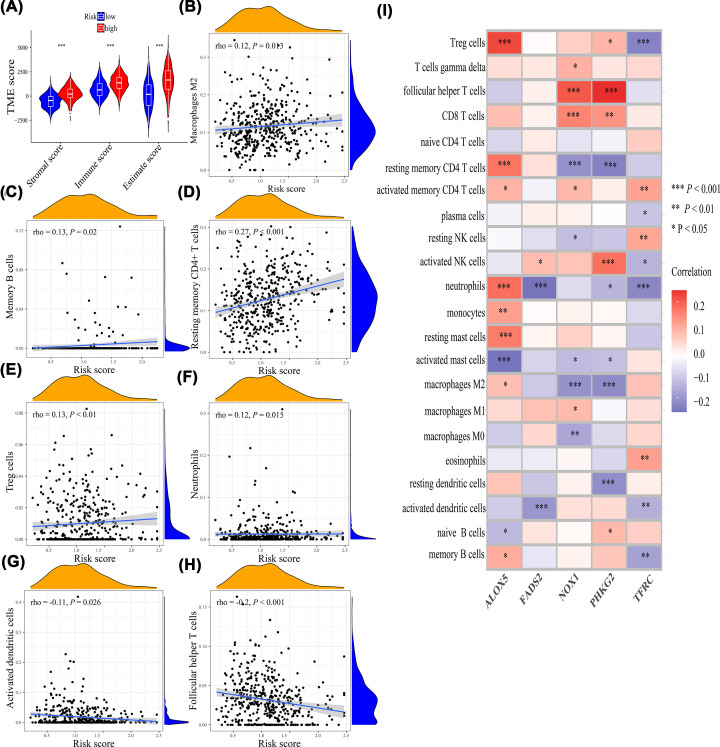
Figure 9. The correlations of risk score with immune infiltration.
(A) Tumor microenvironment score. (B) Macrophages M2. (C) Memory B cells. (D) Resting memory CD4+ T cells. (E) Treg cells. (F) Neutrophils. (G) Activated dendritic cells. (H) Follicular helper T cells. (I) The correlations of five genes with immune infiltration; *P<0.05, **P<0.01, ***P<0.001.

