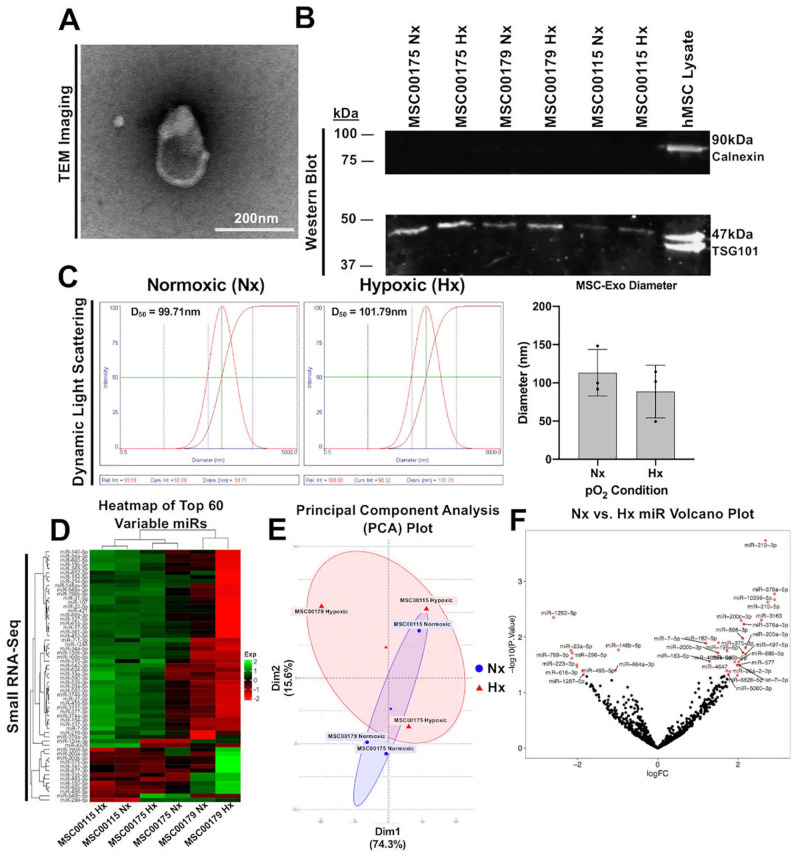
Figure 2.
MSC-Exos exhibited biophysical and biochemical properties that align with established exosome properties, with no difference observed between pO2 conditioning environments in MSC-Exo protein expression, hydrodynamic diameter, or small RNA-Seq analyses. (A) Representative transmission electron microscope image of an MSC-Exo following isolation. TEM magnification = 25 K; Scale bar = 200 nm. (B) Western blot of positive exosome marker TSG101 and negative exosome marker Calnexin. (C) Representative lognormal distributions of MSC-Exo hydrodynamic diameter obtained via dynamic light scattering, with no significant differences observed between Nx and Hx MSC-Exos. (D) Heatmap of the 60 miR transcripts with the highest observed variability across MSC-Exo groups. (E) Principal component analysis plot of the MSC-Exo groups using the 2 most variable dimensions. (F) Volcano plot of upregulated and downregulated miR transcripts. Transcripts labeled as red for nominal P < 0.05 (P value before multiple-test correction). Y-axis = −log10(pnominal) and X-axis = log2(Fold Change). MSC-Exo = mesenchymal stem cell-derived exosome; TEM = transmission electron microscopy.

