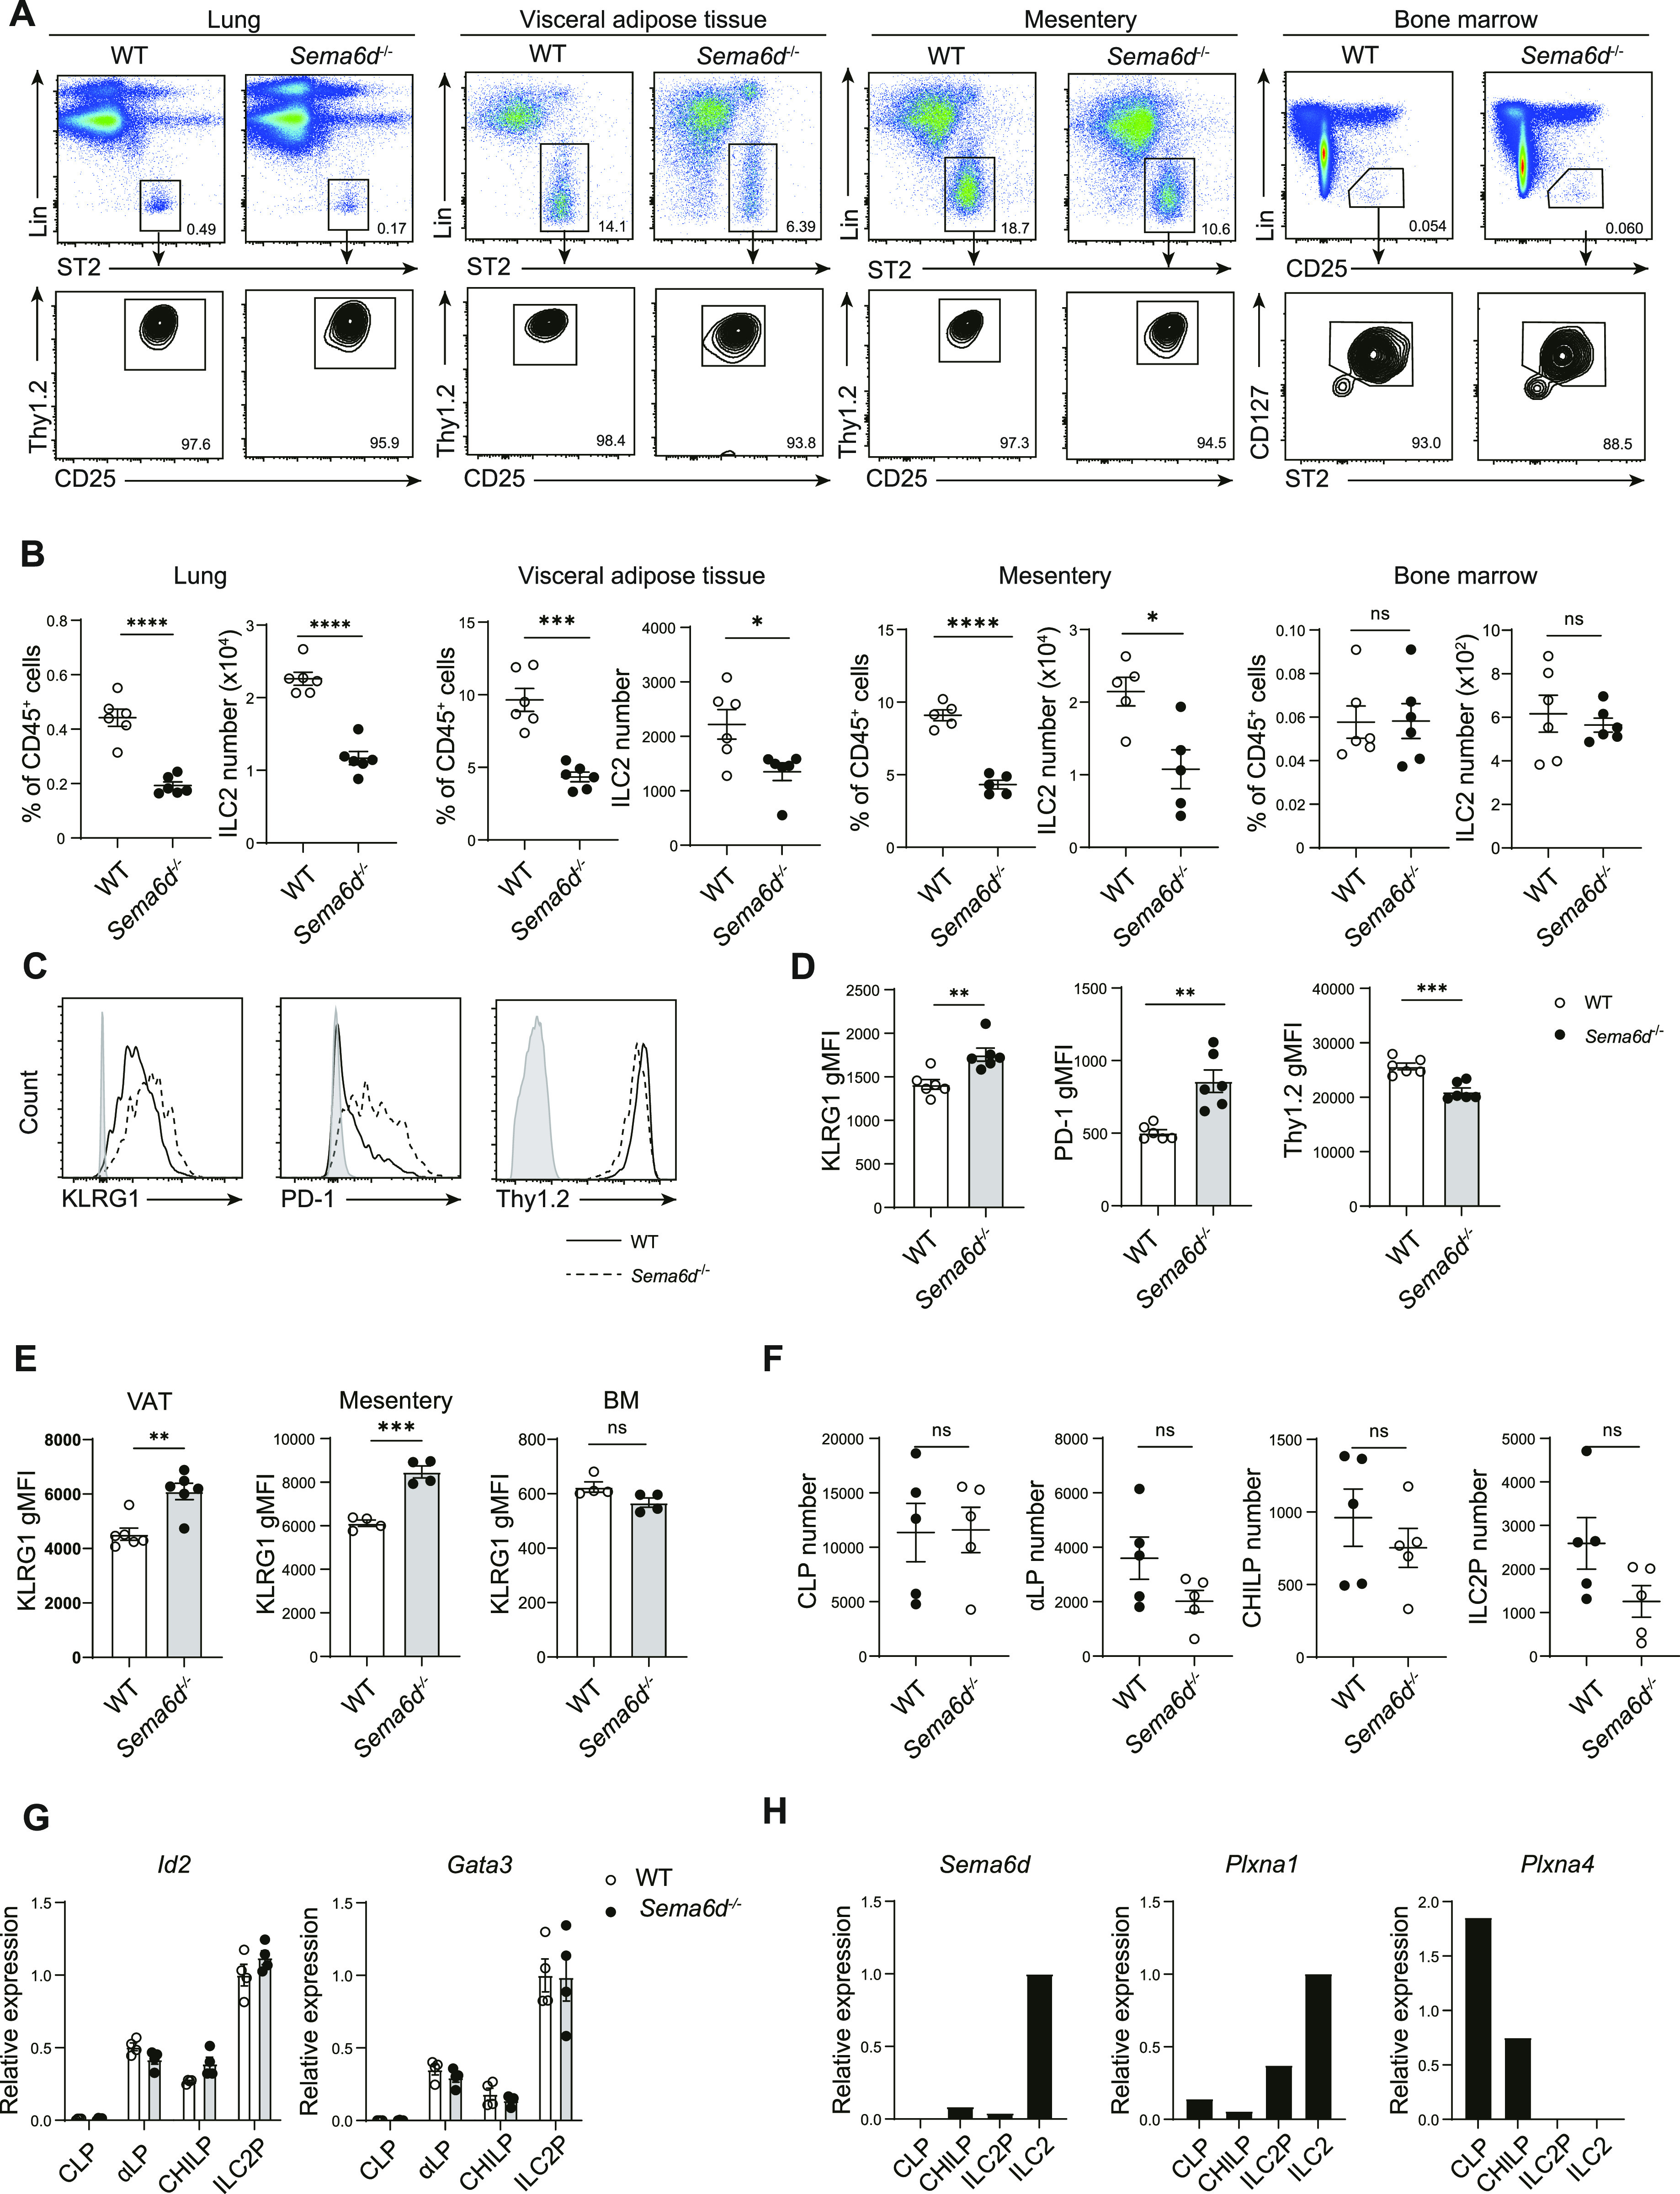
Figure 1. Loss of Sema6D reduces ILC2s in peripheral tissues.

(A) Representative flow cytometry plots of ILC2s in peripheral tissues and BM from WT and Sema6d−/− mice. (B) The frequencies and numbers of ILC2s (CD45+ Lin− ST2+ CD90.2+ Thy1.2+) in (A) are shown (n = 4–6, per group). (C) Representative flow cytometric analysis of KLRG1, PD-1, and Thy1.2 expression, and geometric mean fluorescence intensity levels of lung ILC2s. (D) Geometric mean fluorescence intensity levels of KLRG1 in (A) are shown (n = 6, per group). (E) Geometric mean fluorescence intensity levels of KLRG1 in visceral adipose tissue, mesentery, and BM (n = 4–6, per group). (F) The numbers of CLP, α-LP, CHILP, and ILC2 cells in BM from WT and Sema6d−/− mice (n = 5, per group). (G) The mRNA expression of Id2 and Gata3 on BM CLP, α-LP, CHILP, and ILC2P cells measured by qRT-PCR. (H) The mRNA expression of Sema6d, Plxna1, and Plxna4 on BM CLP, CHILP, ILC2P, and ILC2 cells measured by qRT-PCR. Data are representative of three independent experiments (mean ± SEM). *P < 0.05; **P < 0.01; ***P < 0.001 by t test.
