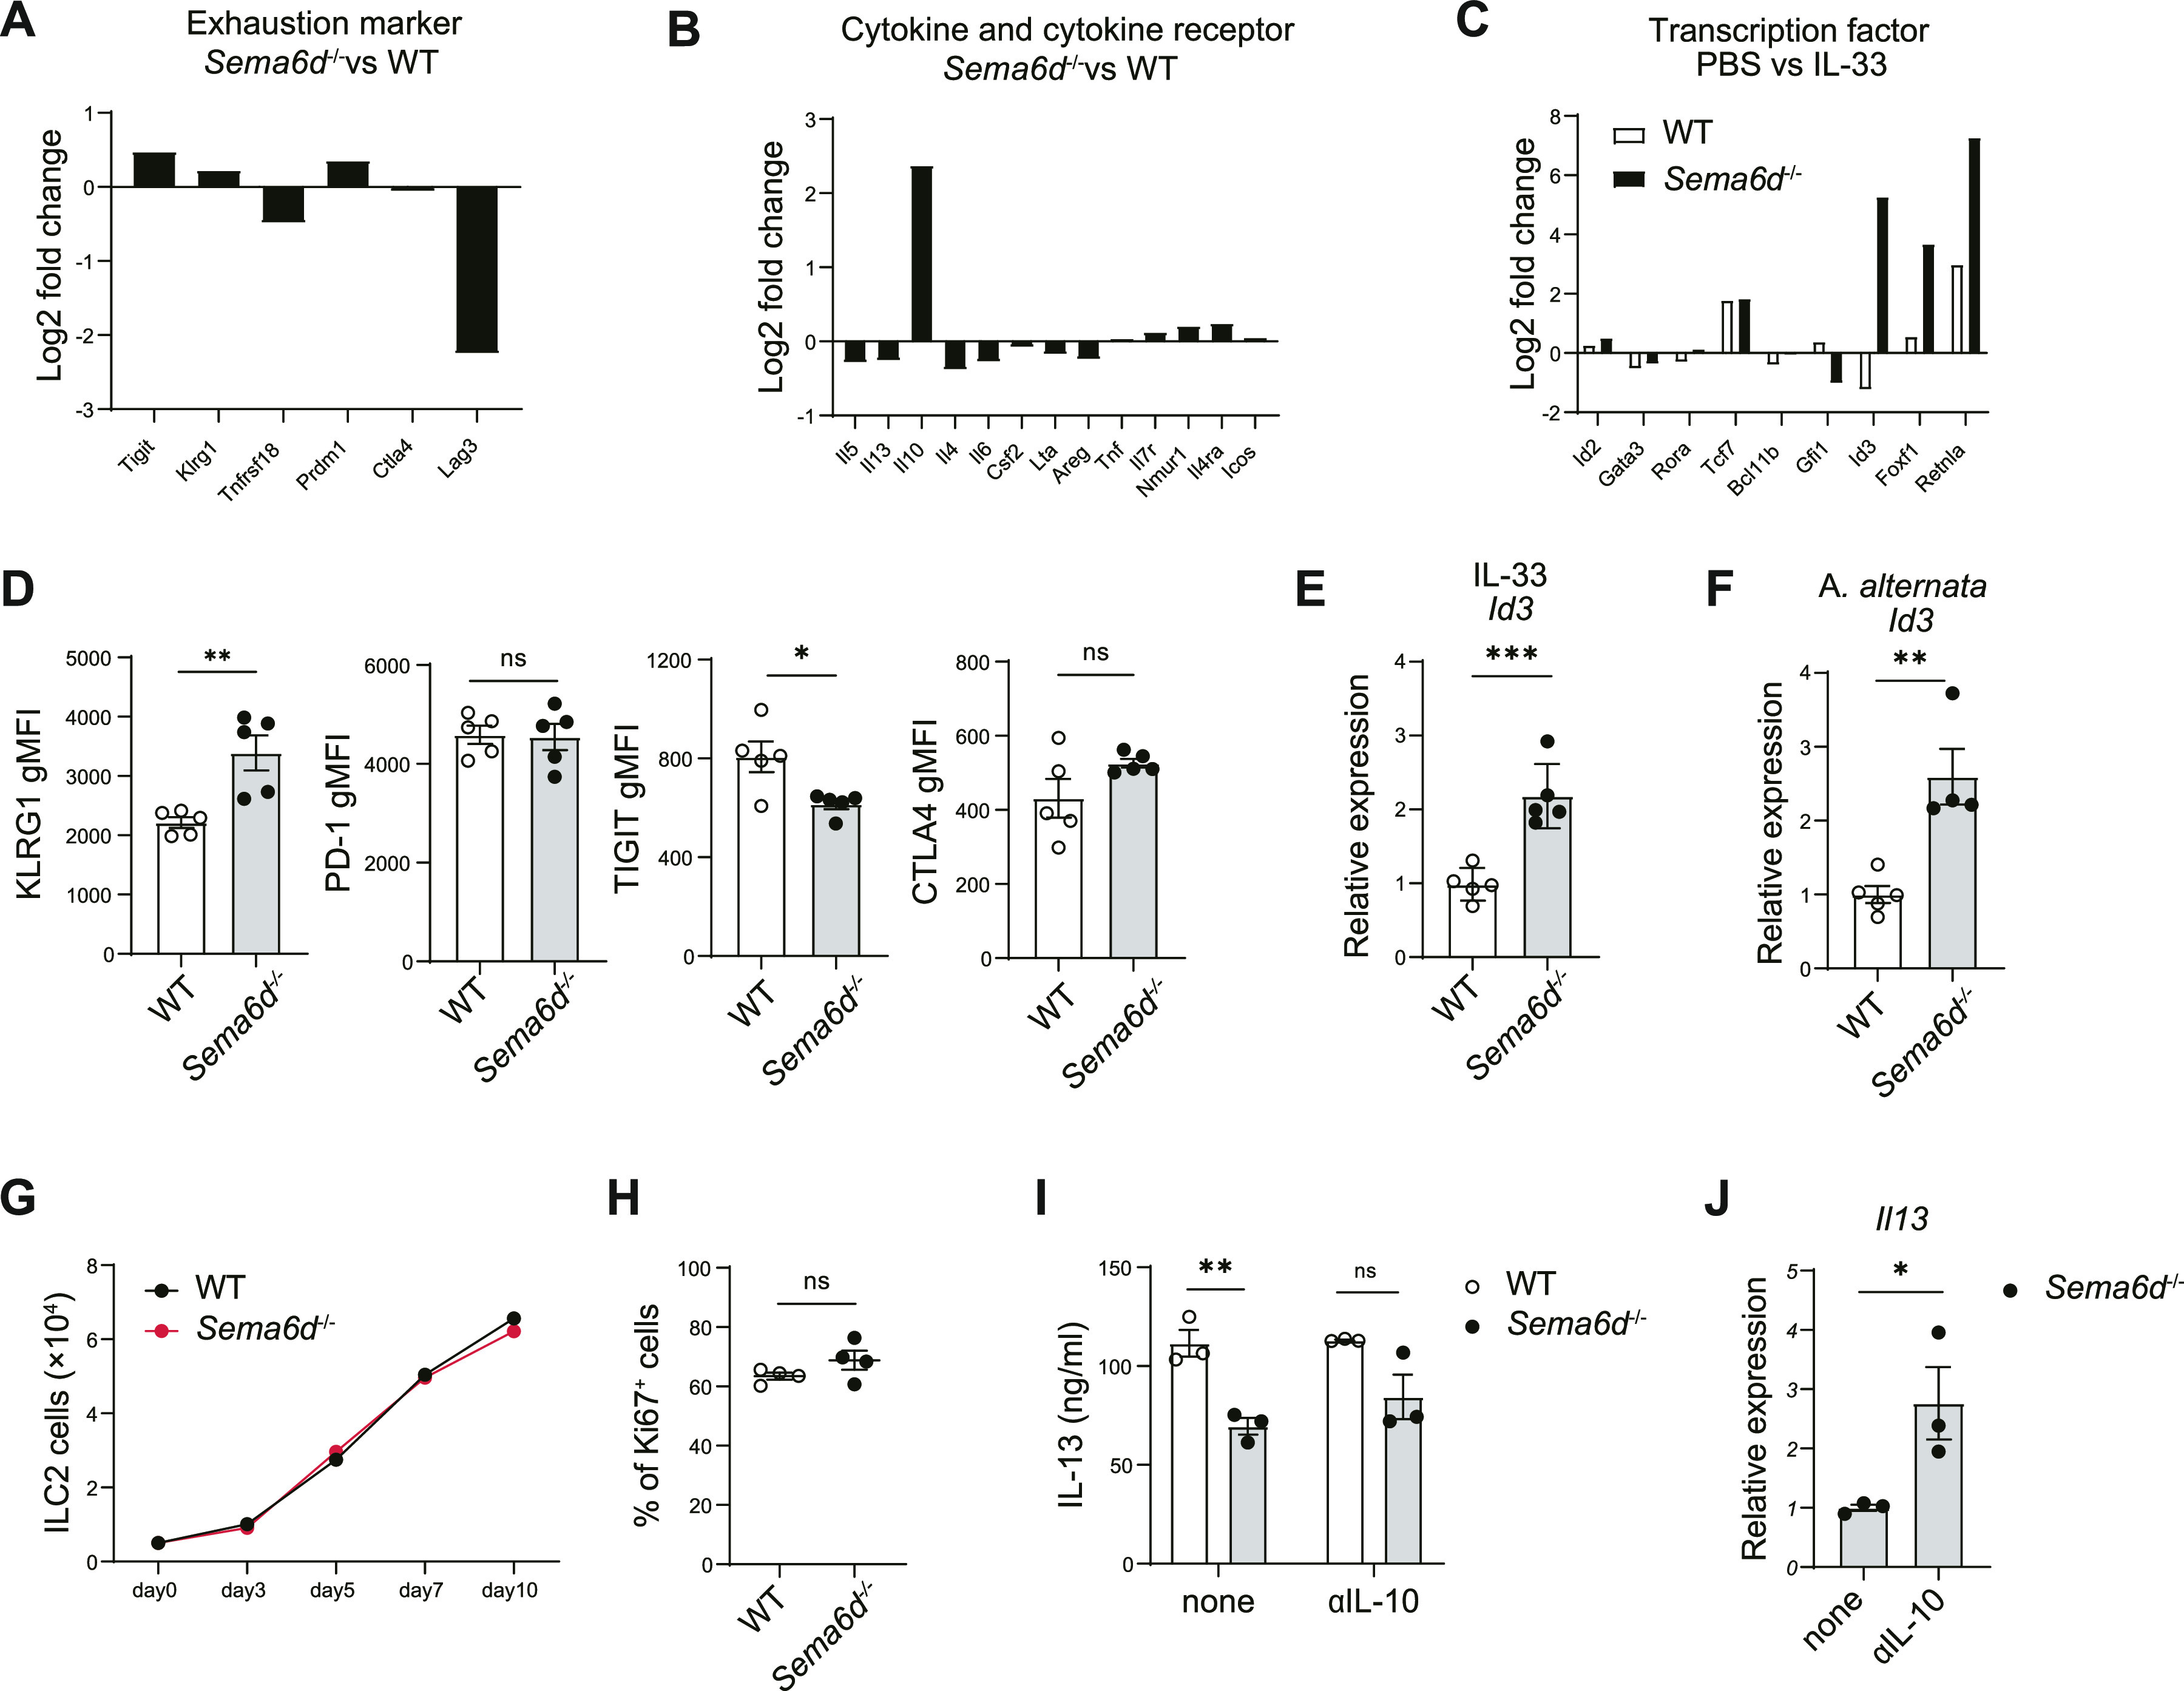
Figure 3. Sema6D suppresses the regulatory features of ILC2s.

(A, B) Mean fold changes of RPKM values of the indicated genes in ILC2s from Sema6d−/− mice versus WT mice after stimulation with IL-33 for 3 d. (C) Mean fold changes of RPKM values of the indicated genes in ILC2s stimulated with PBS versus IL-33. (D) WT mice and Sema6d−/− mice were treated with IL-33. The expression of the indicated genes in lung ILC2s was evaluated with qRT-PCR. These RNA samples were independent from those used to generate RNA-seq data. (E, F) WT and Sema6d−/− mice were treated with IL-33 or A. alternata. The expression of Id3 in lung ILC2s was evaluated with qRT-PCR. (G) Quantification of lung ILC2 cells (5 × 10³ cells; duplicate wells) cultured for 10 d with IL-2 and IL-33 (10 ng/ml each). (H) Frequencies of Ki67+ ILC2s from WT and Sema6d−/− mice. (I) Concentrations of IL-13 in the supernatants of ILC2s (1 × 10⁴ cells) isolated from the lungs of WT and Sema6d−/− mice, cultured in the presence of IL-2 and IL-33 with or without anti-IL-10 for 72 h, as determined by ELISA. (J) The mRNA expression of Il13 in (I) was evaluated by qRT-PCR. Data are representative of three independent experiments (mean ± SEM). *P < 0.05; **P < 0.01; ***P < 0.001 by t test. RPKM, reads per kilobase of exon per million mapped reads.
