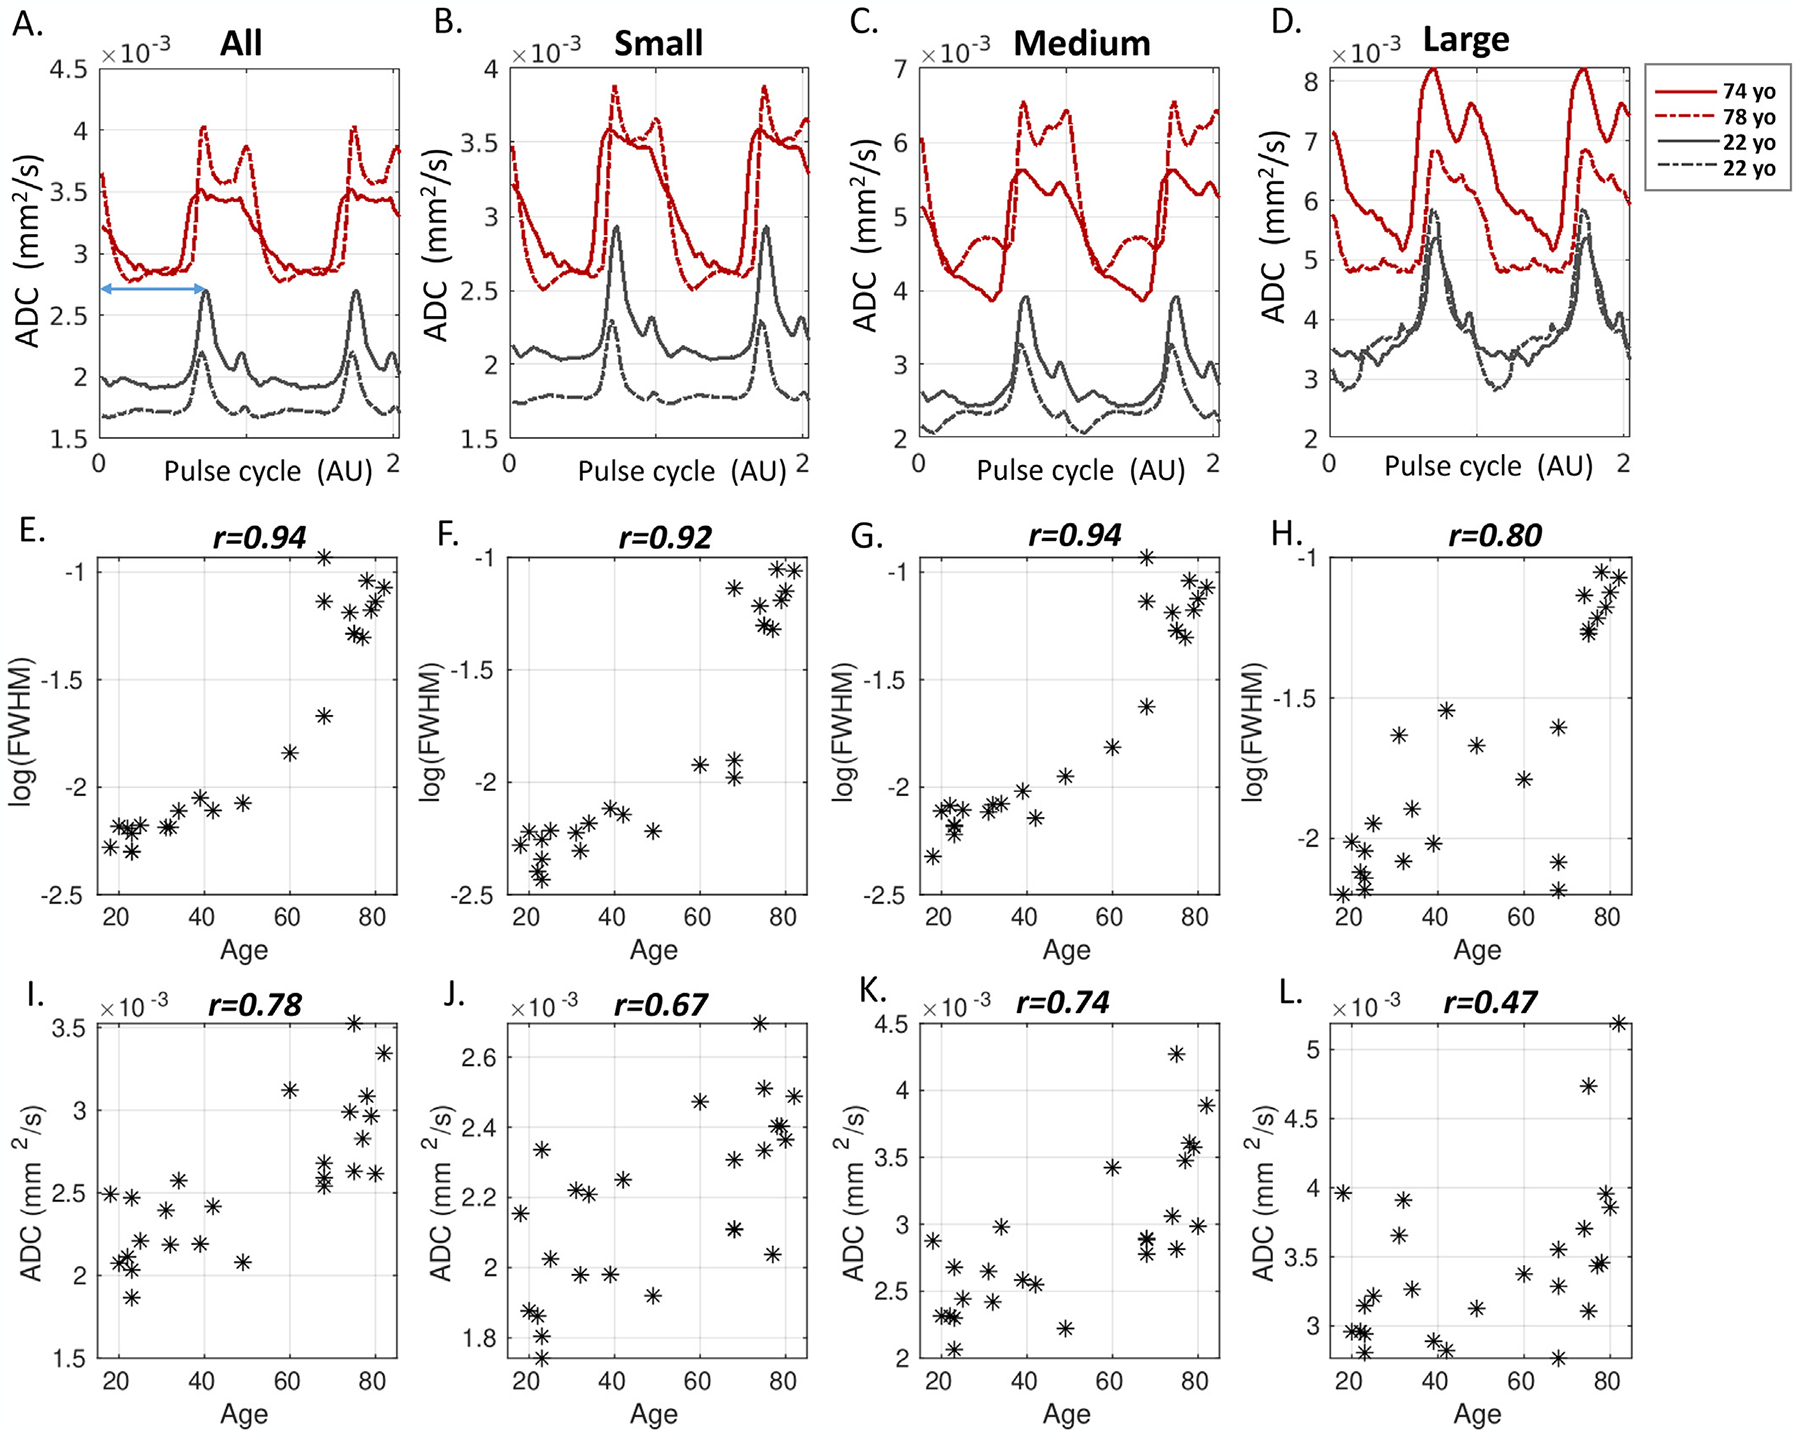
Fig. 11.

Age-dependency of pCSF waveforms. A-D: Representative pCSF waveforms of two younger and two older participants. E-H: Scatter plots of FWHM (log-transformed) as a function of age in all 25 participants. A high correlation between FWHM and age is found, with the Pearson correlation r-value displayed on top. I-L: Scatter plot of trough ADC against age. Older age showed a higher trough ADC.
