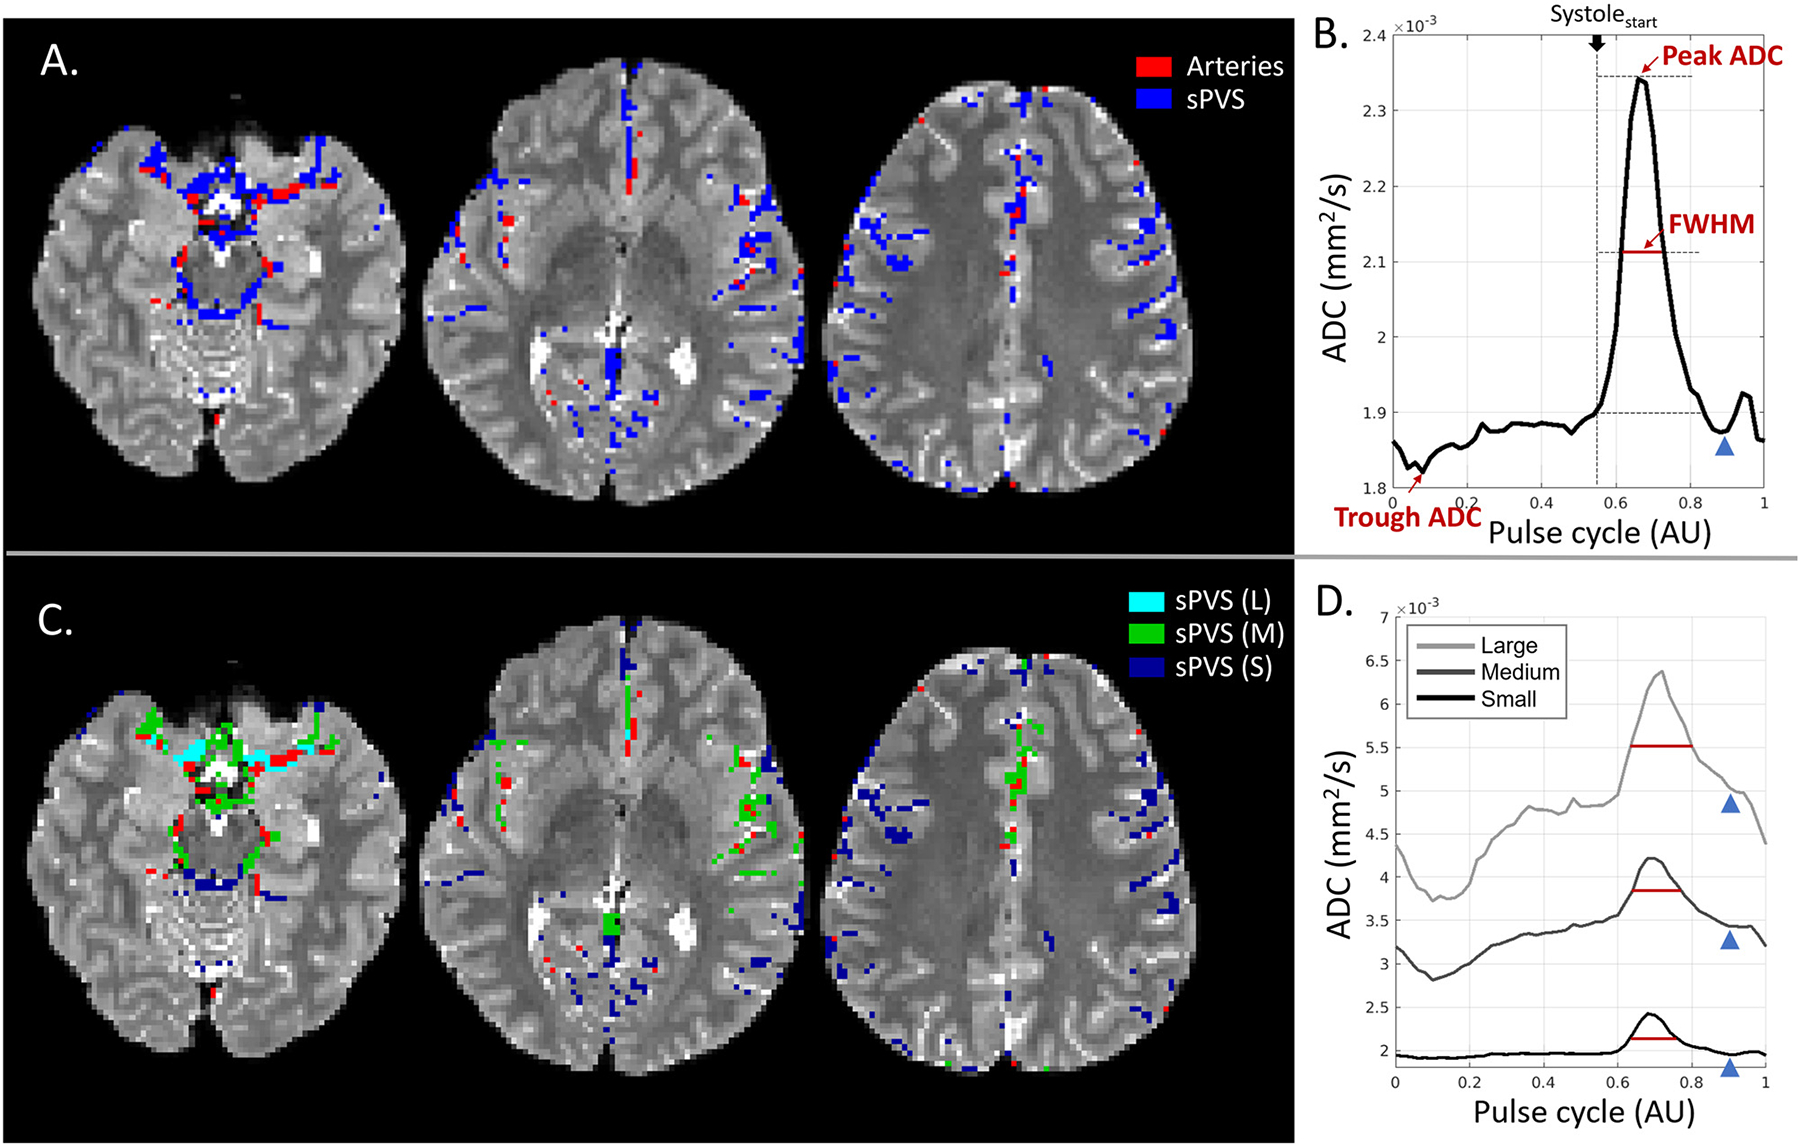
Fig. 4.

CSF waveform and its dependency on adjacent artery sizes. (A). Surface paravascular space (sPVS) (blue) and artery mask (red) overlaid on T2W from three slices. (B). Averaged ADC waveform in the whole-brain sPVS. The full width at half max (FWHM) was used to quantify the systolic peak width. (C). sPVS was divided into Small (dark blue), Medium (green), and Large (light blue) based on adjacent artery diameters using the radius map of the artery atlas. (D). Averaged ADC waveforms calculated in the Small, Medium, and Large sPVS. The blue arrowheads indicate the “dicrotic notch” toward the end of the systolic phase. L: Large; M: Medium; S: Small.
