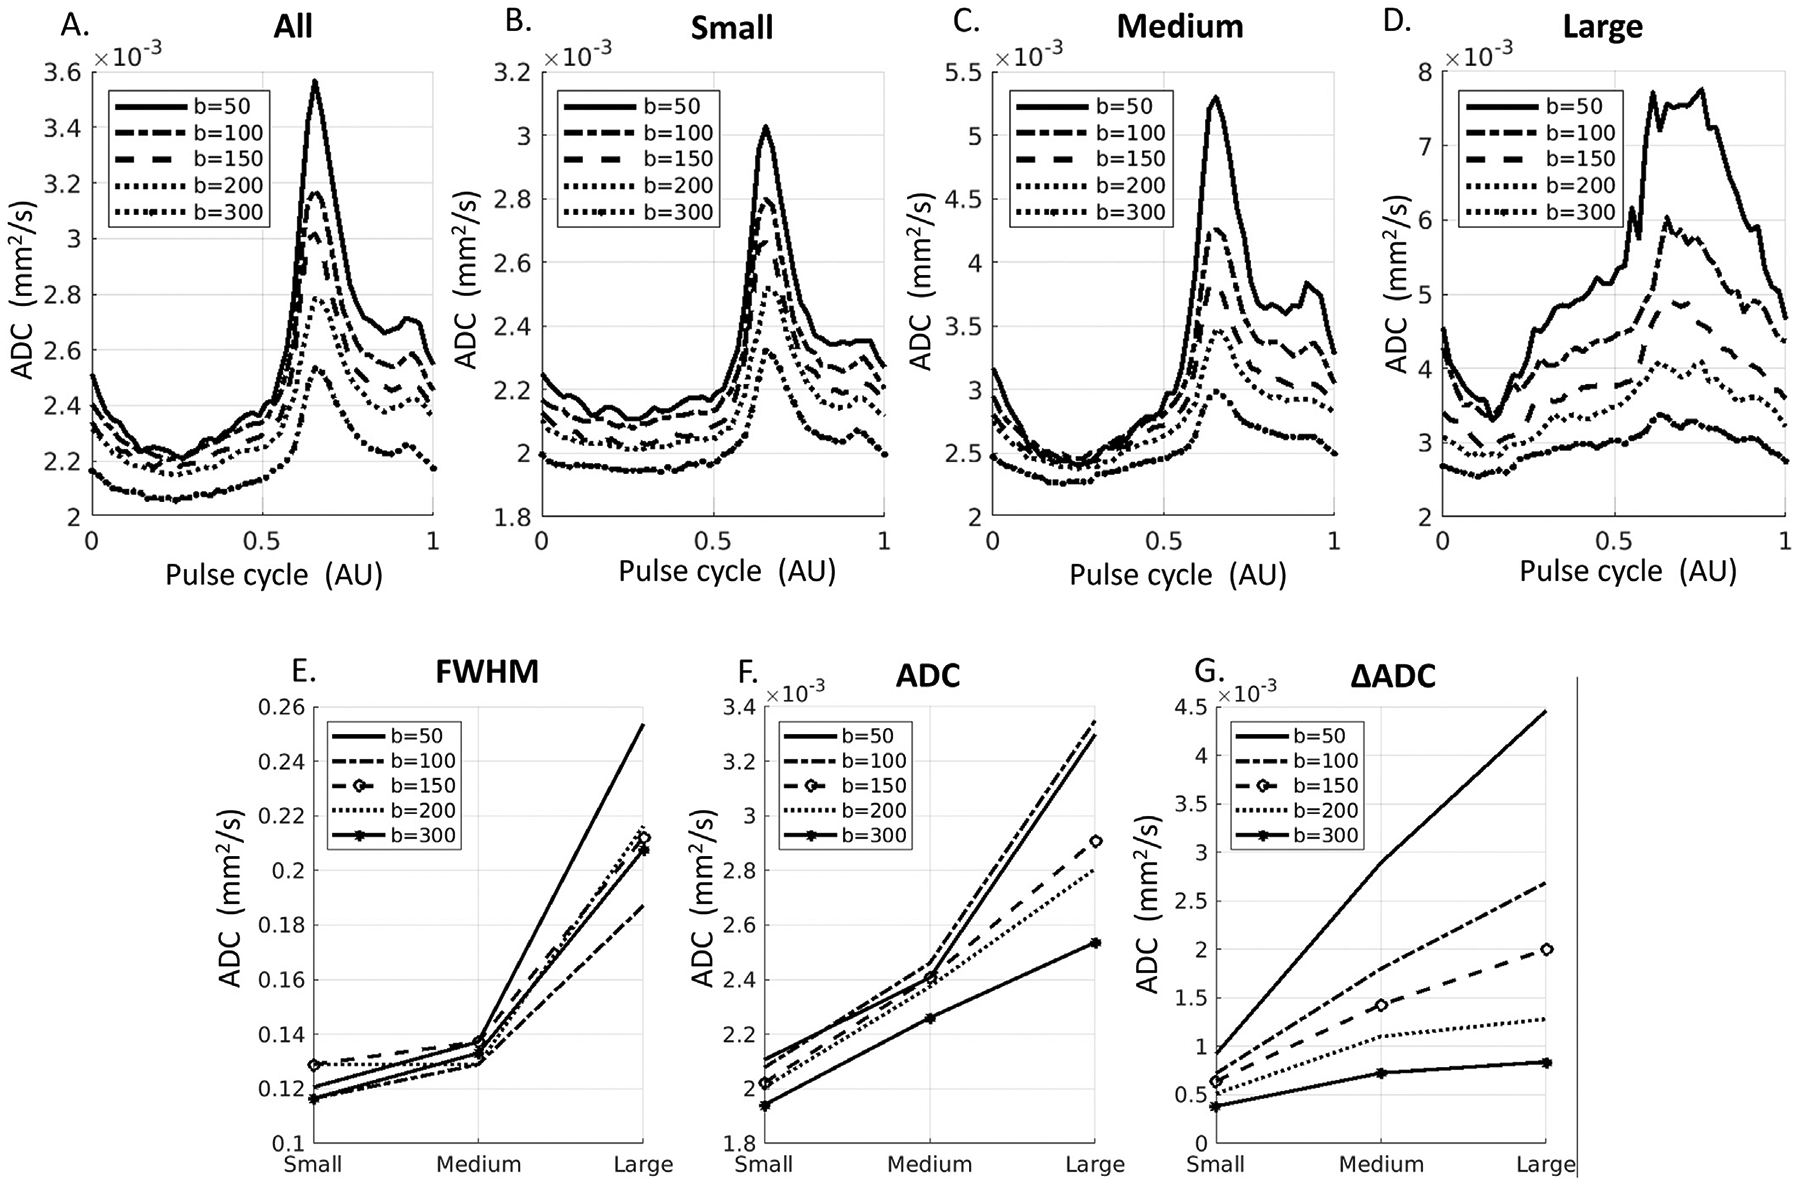
Fig. 6.

pCSF waveforms at fives b-values (50, 100, 150, 200, 300 s/mm2). A-D: Waveforms from All, Small, Medium, and Large sPVS regions. E-G: Comparison of waveforms metrics for Small, Medium and Large sPVS spaces. FWHM: Full-width at half maximum of the diastolic peak. ADC: baseline/trough ADC values. ΔADC: Peak-Trough ADC differences.
