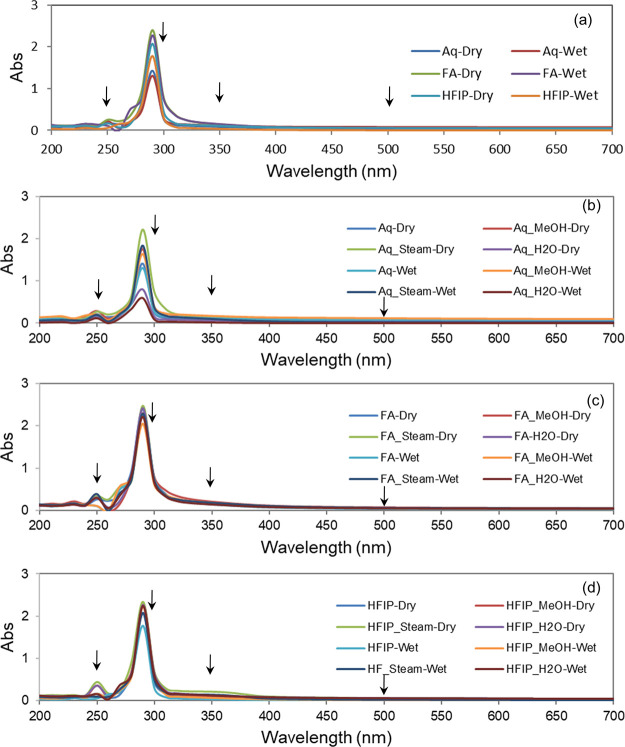
Figure 7.
UV–Vis spectral data of silk fibroin films. Absorption spectra of (a) aq, FA, and HFIP films without annealing, (b) aq films with and without annealing, (c) FA films with and without annealing, and (d) HFIP films with and without annealing (arrows indicate representative UVC, UVB, UVA, and visible spectral regions at 250, 300, 350, and 500 nm, respectively).

