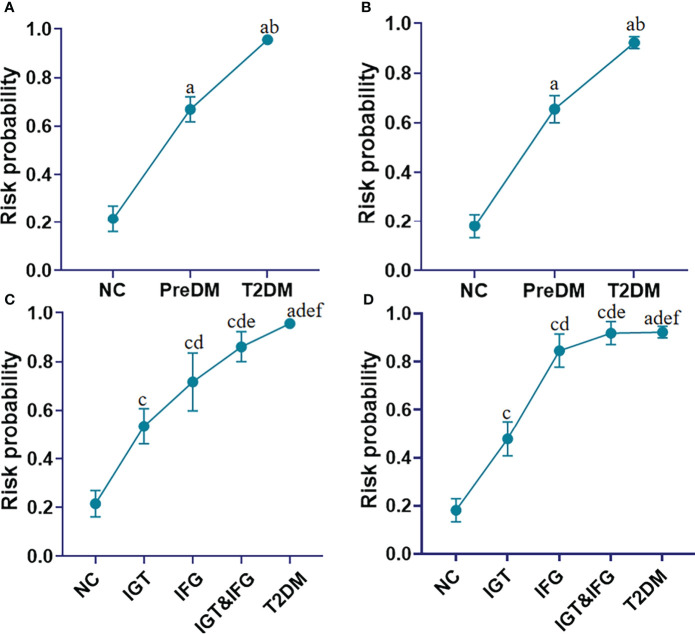
Figure 5.
Line charts present the risk probability of developing into T2DM in the cohorts of the NC, PreDM and T2DM in the discovery (A) and validation (B) sets based on addition of FA 18:2, FA 20:2, SM 32:1, SM 40:7, PC 32:0, PC 38:7, PC 40:6 to Age, BMI, and FPG; Line charts present the risk probability of developing into T2DM in the cohorts of the NC, subgroups of PreDM including IGT to IFG to IFG&IGT, and T2DM in the discovery (C) and validation (D) sets based on addition of FA 18:2, FA 20:2, SM 32:1, SM 40:7, PC 32:0, PC 38:7, PC 40:6 to Age, BMI, and FPG. a P< 0.05, when T2DM and PreDM are compared with NC; b P< 0.05, when T2DM is compared with PreDM, c P< 0.05, when IGT, IFG and IGT&IFG is compared with NC, d P< 0.05, when IFG, IGT&IFG and T2DM is compared with IGT, e P< 0.05, when IGT&IFG and T2DM is compared with IFG, f P< 0.05, when T2DM is compared with IGT&IFG. Data represent mean with 95% CI.

