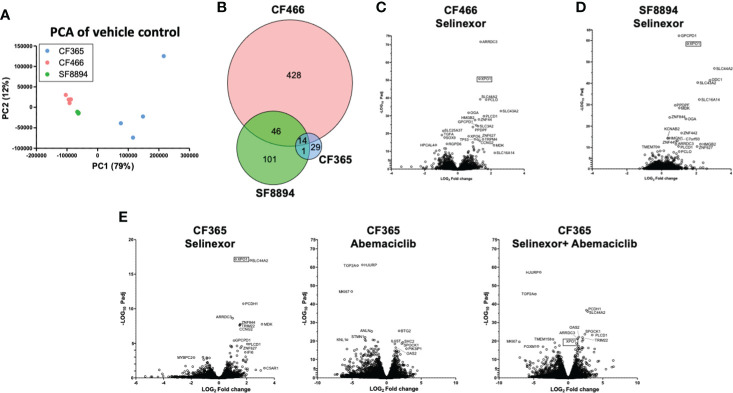
Figure 4.
Differential expression analysis in treated xenografts compared to matched vehicle controls. (A) Principal component analysis (PCA) analysis of gene-level expressions in vehicle treated control tumors for the indicated PDX models. Each dot represents one tumor. (B) Venn diagram indicating the number of genes differentially expressed in selinexor treated tumors compared to match vehicle controls. (C–E) Volcano plots show comparison of all expression of genes between indicated treatment group and vehicle control for CF466 (C) SF8894 (D) and CF365 (E) models. Y-axis is significance and x-axis is fold change. Top significant genes are labeled. XPO1 is indicated with a box.

