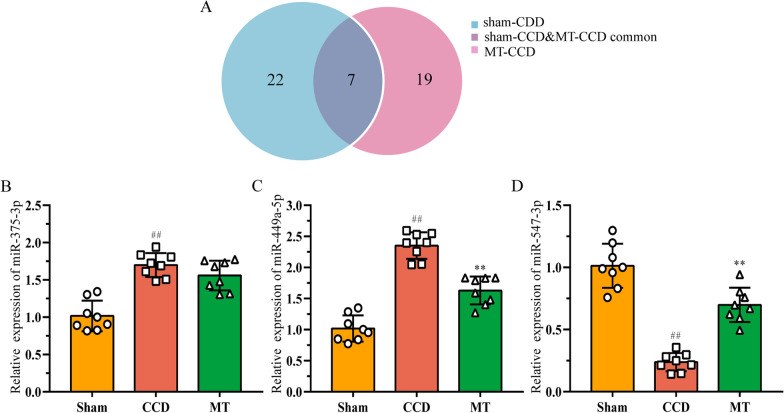
Fig. 4.
Validations of miRNAs with high fold change between different groups. A Venn diagram of miRNAs differentially expressed between the groups. B–D Relative expression of miR-375-3p, miR-449a-5p, and miR-547-3p was detected using qRT-PCR to validate the sequencing results. The data are expressed as mean ± SD (N = 8) and analyzed for statistical significance using one-way ANOVA followed by LSD post hoc analysis for multiple comparisons (##P < 0.01 versus sham group, **P < 0.01 versus CCD group). CCD chronic compression of dorsal root ganglion, LSD least significant difference, MT manual therapy, qRT-PCR real-time quantitative reverse transcription PCR

