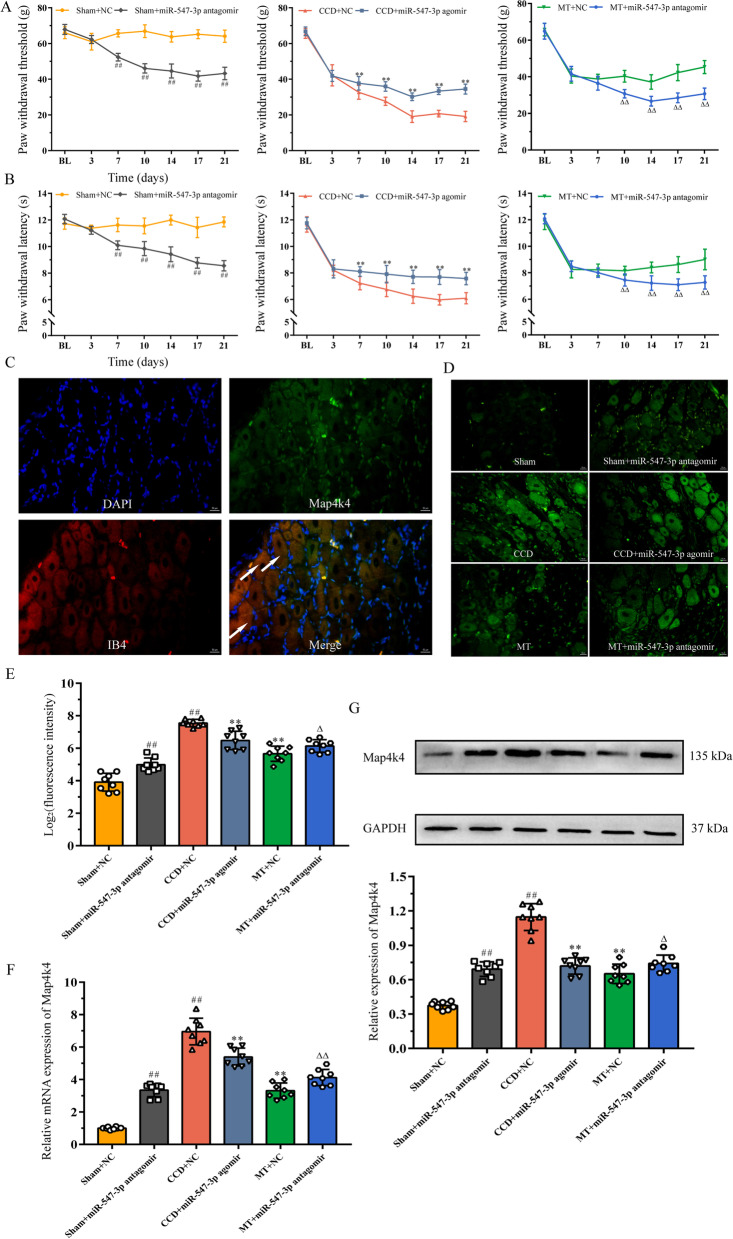
Fig. 6.
MT reduces neuropathic pain by regulating miR-547-3p targeting Map4k4. A, B PWT and PWL of rats were measured to assess their mechanical and thermal hyperalgesia. The data are expressed as mean ± SD (N = 8). Repeated measurement ANOVA was used to analyze the data at various time points between the groups and one-way ANOVA followed by LSD post hoc analysis was used for pairwise comparison (at the same time point, ##P < 0.01 versus sham + NC group, **P < 0.01 versus CCD + NC group, and ΔΔP < 0.01 versus MT + NC group). C, D Immunofluorescence staining reveals the expression and cellular distribution of Map4k4 in different groups; white arrows indicate the co-expression of Map4k4 (green fluorescent) and IB4-positive nociceptors (red fluorescent) in DRG neurons (scale bar = 50 μm). E Quantification analysis of Map4k4 fluorescence intensity. The data are expressed as mean ± SD (N = 8) and analyzed for statistical significance using one-way ANOVA followed by Dunnett’s T3 post hoc analysis for multiple comparisons (##P < 0.01 versus sham + NC group, **P < 0.01 versus CCD + NC group, ΔP < 0.05 versus MT + NC group). F, G qRT-PCR and Western blot analysis show the relative mRNA and protein expression of Map4k4, respectively. The data are expressed as mean ± SD (N = 8). One-way ANOVA followed by LSD post hoc analysis was used for protein expression, and one-way ANOVA followed by Dunnett’s T3 post hoc analysis was used for relative mRNA expression (##P < 0.01 versus sham + NC group, **P < 0.01 versus CCD + NC group, ΔP < 0.05, and ΔΔP < 0.01 versus MT + NC group). ANOVA analysis of variance, CCD chronic compression of dorsal root ganglion, LSD least significant difference, MT manual therapy, NC negative control, SD standard deviation

