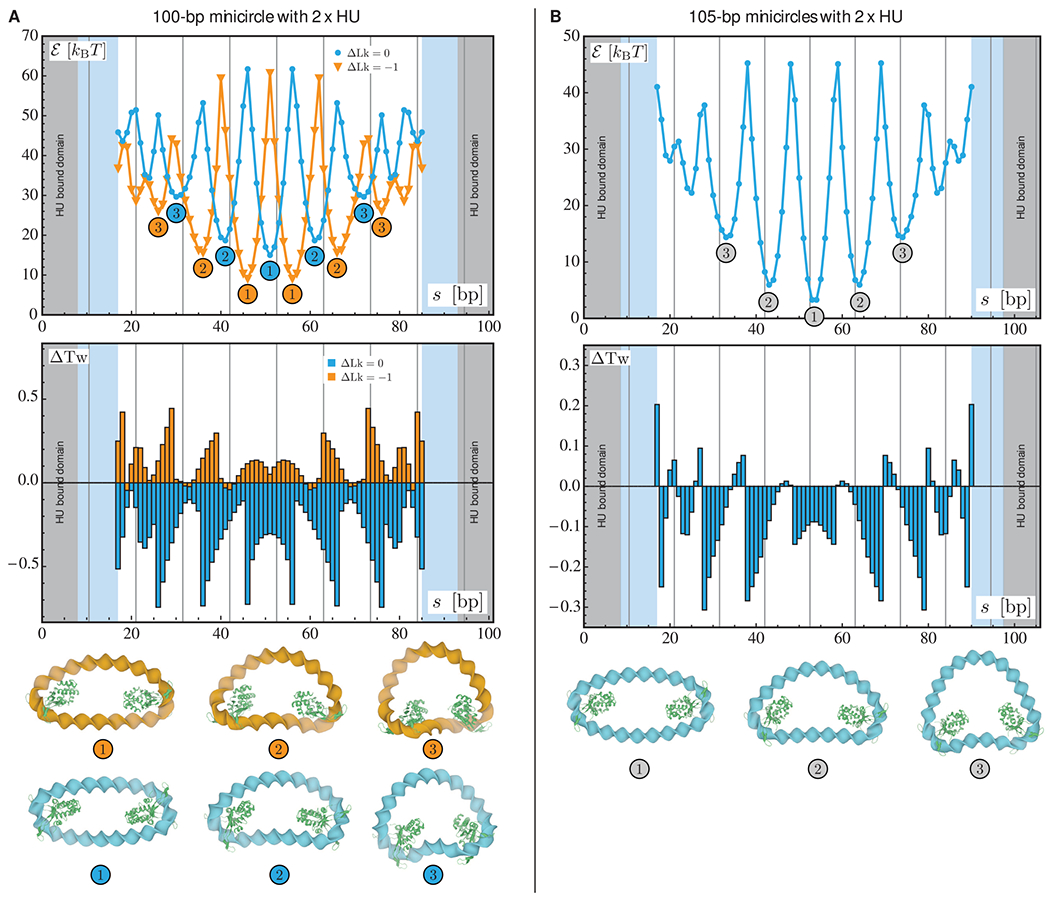
Figure 2.

Optimization results for relaxed and underwound minicircles of 100 bp (A) and relaxed minicircles of 105 bp (B) bearing two HU dimers. For each chain length, the two plots represent the optimized energy (top) and the changes in the total twist (bottom) as functions of the center-to-center spacing s between the two proteins. The results for the relaxed (ΔLk = 0) and underwound (ΔLk = −1) minicircles of 100 bp are represented in blue and orange, respectively. In all plots, the gray areas denote the length of DNA in contact with the first HU dimer and the light blue areas the length in contact with the second dimer. The vertical lines indicate chain lengths equal to integral numbers of helical repeats. The numbers in the energy plot refer to the structures depicted at the bottom of the figure in which the HU proteins are represented in green.
