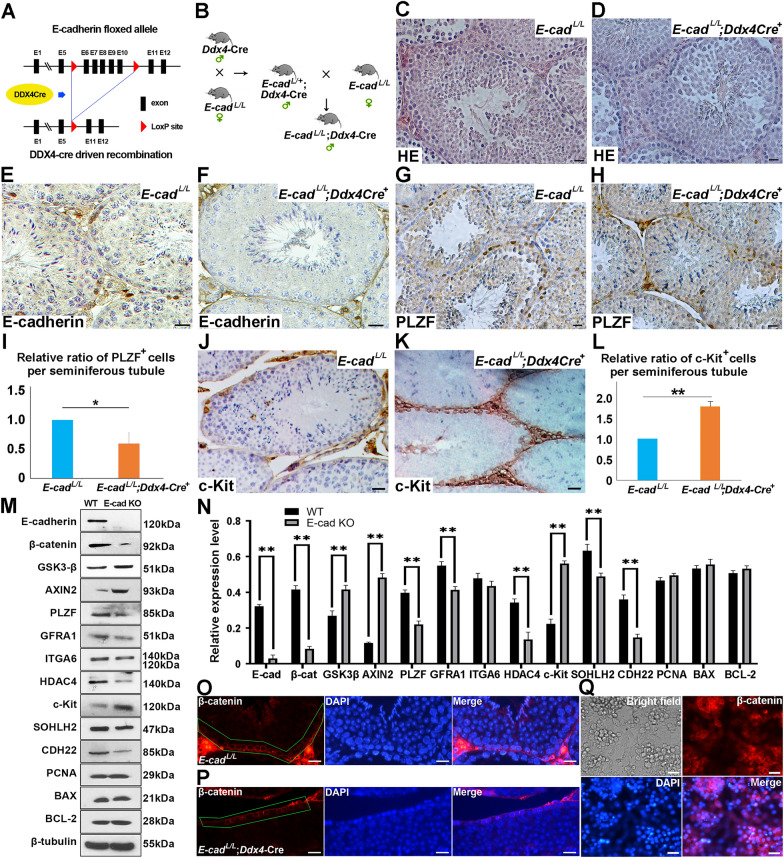
Fig. 2.
Expression of E-cadherin and SPC markers in germline-specific E-cadherin knockout mice. A schematic illustration of conditional knockout of E-cadherin driven by Ddx4-Cre in germ cells (A). The goal mice with E-cadherin germline specific knockout were generated by mating E-cadherin floxed and Ddx4-Cre mice (B). The histology of testes from 90-day old E-cadherinL/L (C) and E-cadherinL/L;Ddx4-Cre+ mice (D) was exhibited. The expression of E-cadherin, PLZF and c-Kit in testes from 90-day old E-cadherinL/L (E E-cadherin, G PLZF, J c-Kit) and E-cadherinL/L;Ddx4-Cre+ (F E-cadherin, H. PLZF, K c-Kit) were determined using IHC. The relative ratio of PLZF+ (I) and c-Kit+ (L) cells per seminiferous tubule in testes from both genotypes was statistically analyzed (for each genotype, 15 tubules from 3 testes were counted). The expression levels of E-cadherin, β-catenin, GSK3-β, AXIN2, PLZF, GFRA1, ITGA6, HDAC4, c-Kit, SOHLH2, CDH22, PCNA, BAX, BCL-2 and β-tubulin were determined in testes from both genotypes at 90-day using Western blot, n = 3 (M), and was statistically analyzed (N). Expression of β-catenin in testes from 90-day old E-cadherinL/L (O) and E-cadherinL/L;Ddx4-Cre+ mice (P) and newly isolated SPCs (Q) was determined using IF. Scale bar = 20 μm, data represent as mean ± SD *p < 0.05; **p < 0.01

