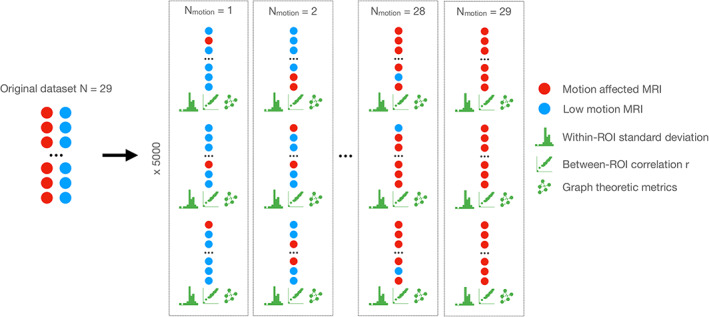
FIGURE 1.

A schematic diagram of our bootstrapping approach to estimating how the inclusion of motion‐affected scans affects structural covariance networks. The original sample of 29 participants with motion‐affected (red circles) and low motion (blue circles) was resampled with systematically increasing numbers of motion‐affected scans. For each sample, the following parameters were estimated: (i) within‐region of interest (ROI) standard deviation across all regions; (ii) between‐ROI correlation (r) across all pairs of ROIs; (iii) graph theoretic metrics derived from structural covariance networks constructed from each sample. Five thousand resamples were taken for each setting of the number of motion‐affected scans to be included in the analyses.
