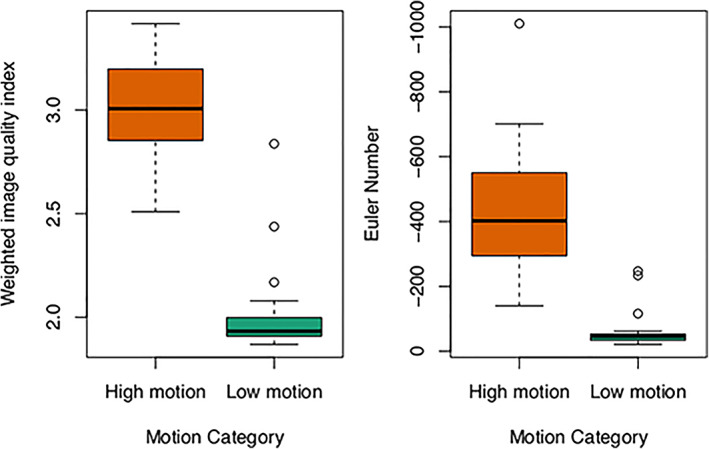
FIGURE 3.

Quantitative image quality indices show that brain MRI quality is reduced (higher weighted image quality index and lower Euler number, p < < .001 for both analyses) in the motion‐affected group. Note that the y‐axis on the Euler number plot is reversed.
