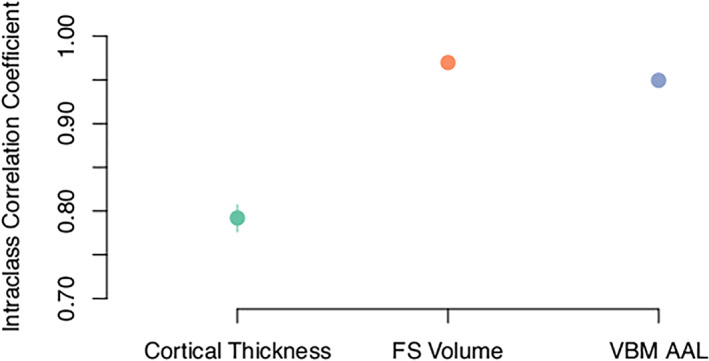
FIGURE 4.

Test–retest variability is higher (lower ICC) when constructing structural covariance networks using cortical thickness estimates compared to volumetric estimates derived from surface‐based (FS volume) and voxel‐based morphometry (VBM AAL) approaches. The 95% confidence intervals for volumetric estimates are smaller than the size of the plot labels.
