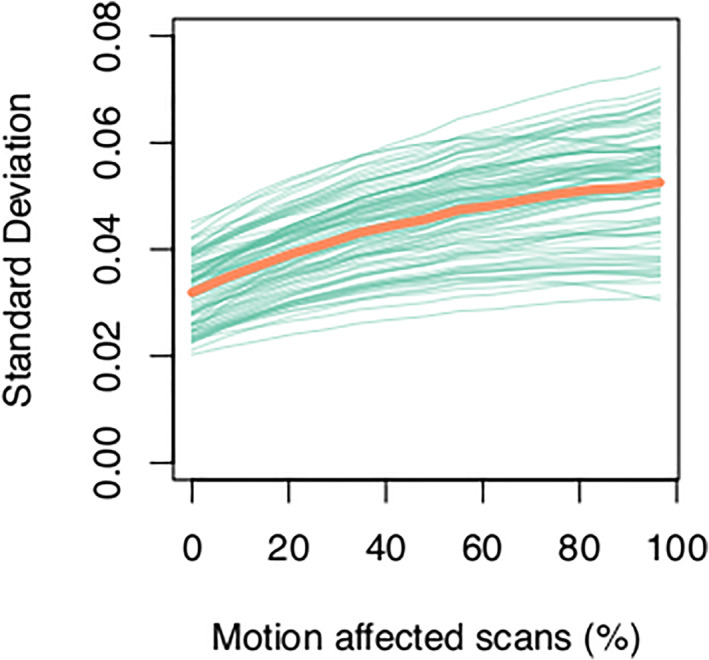
FIGURE 6.

Variability in regional gray matter volume estimates across subjects increases with the number of motion‐affected scans included in a dataset. The standard deviation averaged across all brain regions is shown in orange, with standard deviation in individual brain regions is shown in green.
