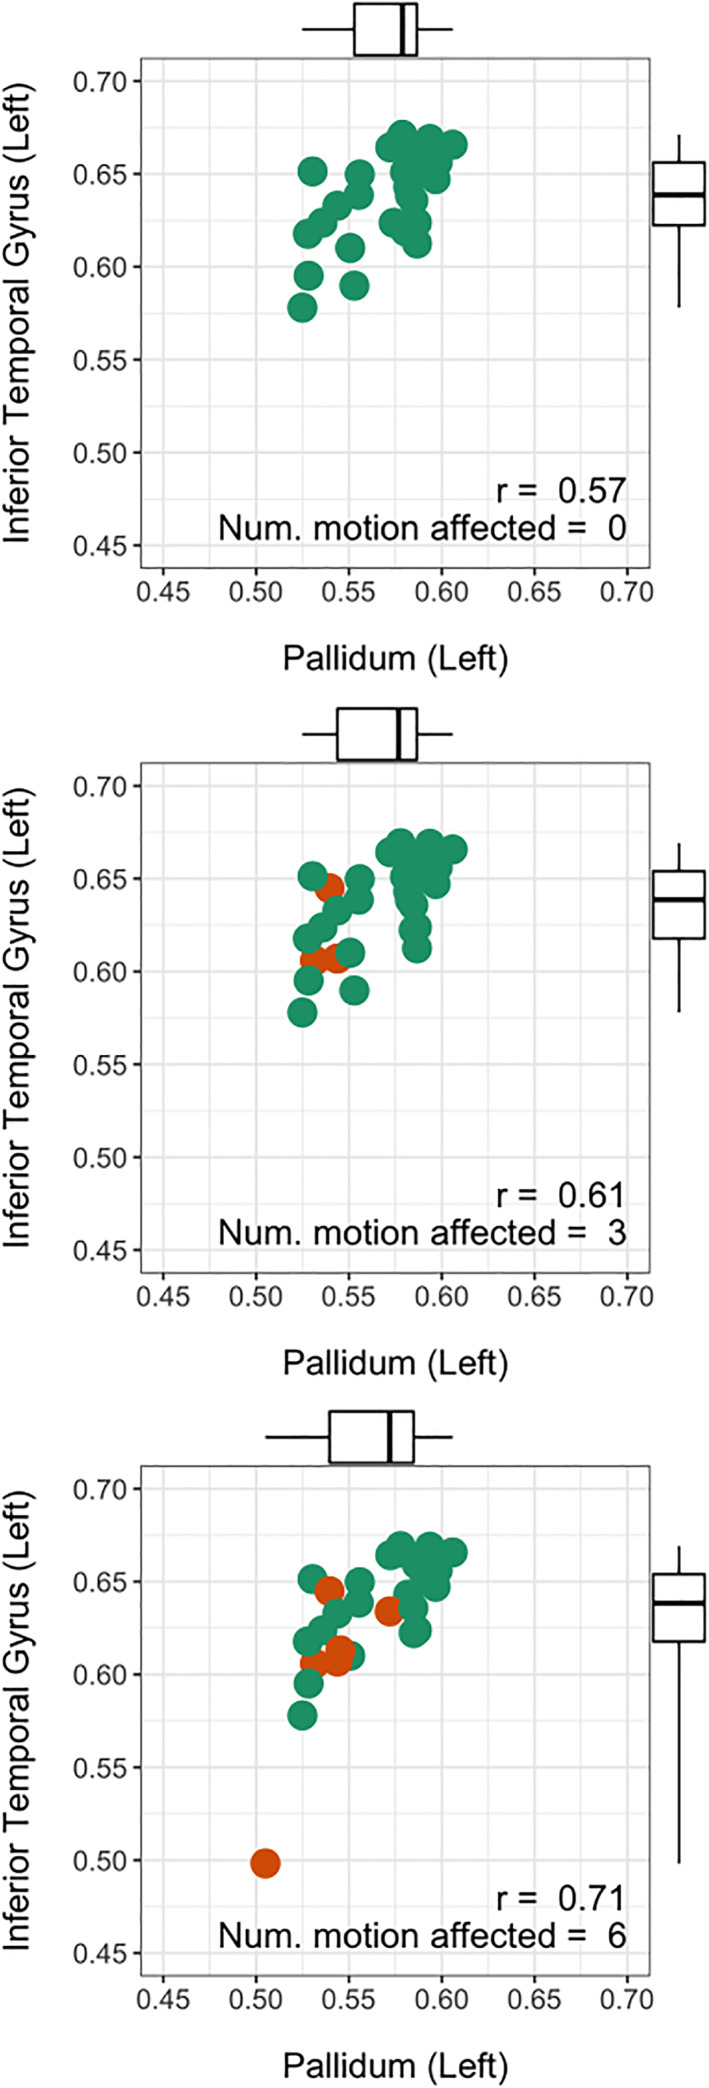
FIGURE 8.

The effect of in‐scanner head motion on the measured correlation in gray matter volume between the pallidum and the inferior temporal gyrus. As more motion‐affected scans are included in the sample, the correlation between these brain regions increases from 0.57 to 0.71.
