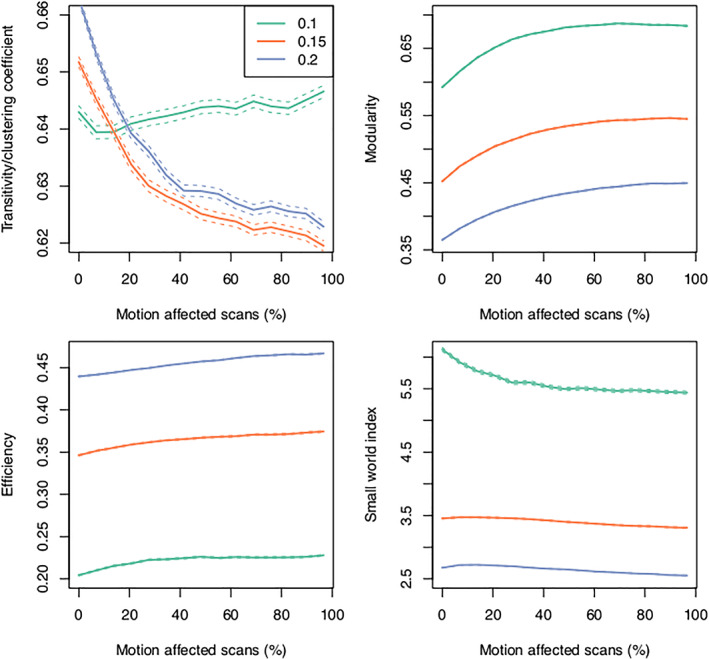
FIGURE 10.

Change in graph theoretic metrics across edge density = 0.1, 0.15, 0.2. The relationship between motion and transitivity (clustering coefficient) is variable depending on the edge density used. Modularity and efficiency increase as the number of motion‐affected scans increases. Small world index generally decreases as the number of motion‐affected scans increases. The dashed lines indicate the 95% confidence interval.
