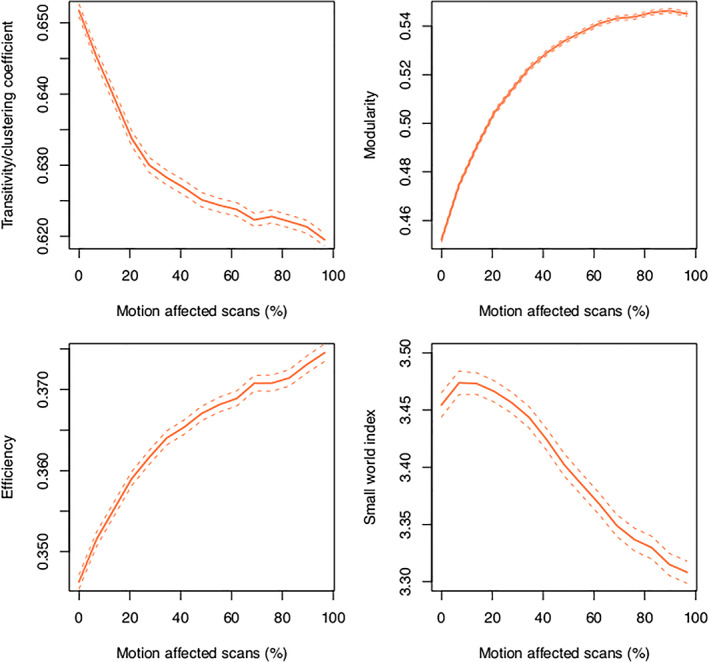
FIGURE 11.

Change in graph theoretic metrics as a function of in‐scanner motion for edge density = 0.15. For transitivity, modularity, and efficiency, the largest changes occurred when a small number of motion‐affected scans were included (<20%). The dashed lines indicate the 95% confidence interval
