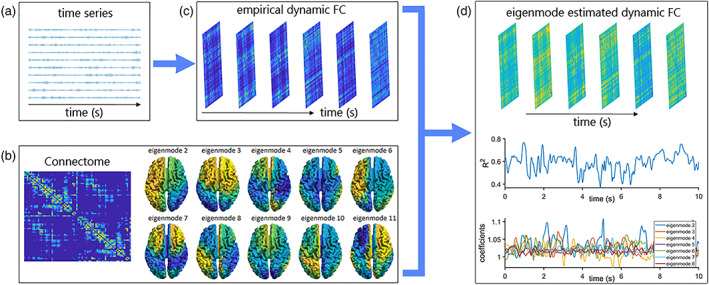
FIGURE 1.

Analysis pipeline. Panel (a) shows an example of bandpass‐filtered timeseries. Panel (b) shows the group‐averaged connectome and the structural eigenmodes obtained from the symmetric normalised Laplacian of this connectome. The Laplacian is defined as , where the refers to the diagonal node strength matrix and to the structural connectivity matrix. Normalisation is computed by . There is an increase in spatial frequency for increasing eigenmode numbers. Panel (c) shows the empirical dynamic functional connectivity (FC). Panel (d) shows the eigenmode‐estimated dynamic FC, along with the goodness‐of‐fit fluctuations over time and the fluctuations of eigenmode expression (coefficients) over time for an arbitrarily selected number of eigenmodes
