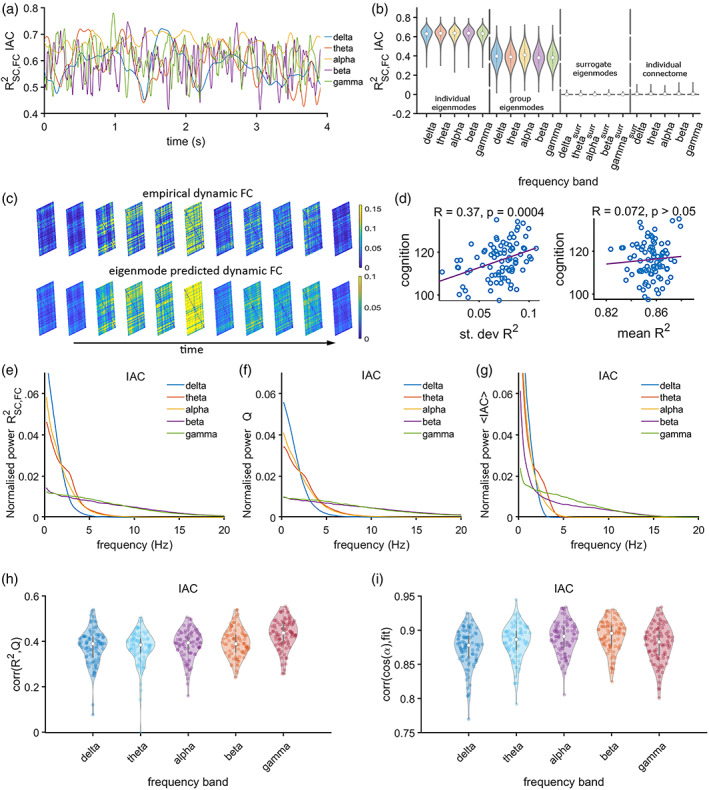
FIGURE 2.

Expression of structural eigenmodes during time‐resolved amplitude coupling. Panel (a) shows a short segment of the fluctuation of the explained variance R 2 of time‐resolved functional connectivity by the linear combination of structural eigenmodes for the different frequency bands (colours as in b). Panel (b) shows violin plots for R 2 values across all participants for the entire recording, together with the R 2 values for surrogate data and R 2 values obtained from the prediction of time‐resolved functional connectivity based on direct structural connections (individual connectome). The eigenmode results are illustrated based on individual eigenmodes (first quadrant) and eigenmodes obtained from the group‐averaged connectome (second quadrant). Panel (c) shows examples of empirical and predicted time‐varying functional connectivity matrices. Panel (d) shows the correlation between mean and SD of the R 2 and cognitive performance. Panels (e, f, g) show the power spectral densities of the time‐series of the goodness‐of‐fit R 2 for experimental data, community structure Q and average functional connectivity, all averaged over subjects. Panel (h) shows a distribution of moderate correlations between the expression of the eigenmodes and fluctuations of community structure over time, across all frequency bands. Panel (i) shows subject‐wise correlations for the goodness‐of‐fit and the cosine of the angle between the degree vector and the amplitude envelope across all regions. A dot in panels (h, i) corresponds to a correlation for a single subject
