
FIGURE 3.
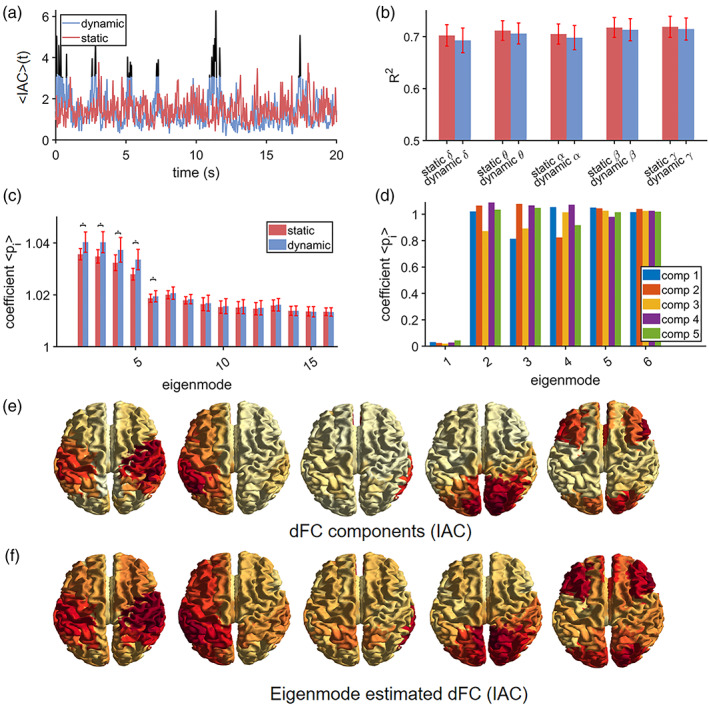
Stationary (static) versus dynamic connectivity (IAC). Results are, apart from panel (b), shown for the beta band. Panel (a) shows a short segment from a single subject of whole brain connectivity fluctuation for genuine data (dynamic connectivity, depicted in blue) and surrogate data with preserved static connectivity (depicted in red). There are brief periods when dynamic connectivity exceeds stationary connectivity (depicted in black). Panel (b) shows the goodness‐of‐fit (R 2) of the eigenmode approach for the stationary connectivity (red) and for the genuine data at time‐points when dynamic connectivity exceeded stationary connectivity (blue). For all frequency bands there is no difference in goodness‐of‐fit between stationary and dynamic connectivity. Panel (c) shows the estimated mapping coefficients for the same conditions as in (b). An asterisk refers to a significant difference (p < 0.001). Dynamic network states for time‐points when dynamic connectivity exceeded stationary connectivity are shown in (e), which shows a sensorimotor network, a lateralised hemispheric network, a right temporal network, a visual network and an occipitoparietal (visual)/frontal network. Eigenmode predicted brain maps and mapping coefficients are depicted in (f) and (d), respectively. , average eigenmode coefficients; dFC, dynamic functional connectivity, comp., component, PDD, phase difference derivative, R 2, explained variance