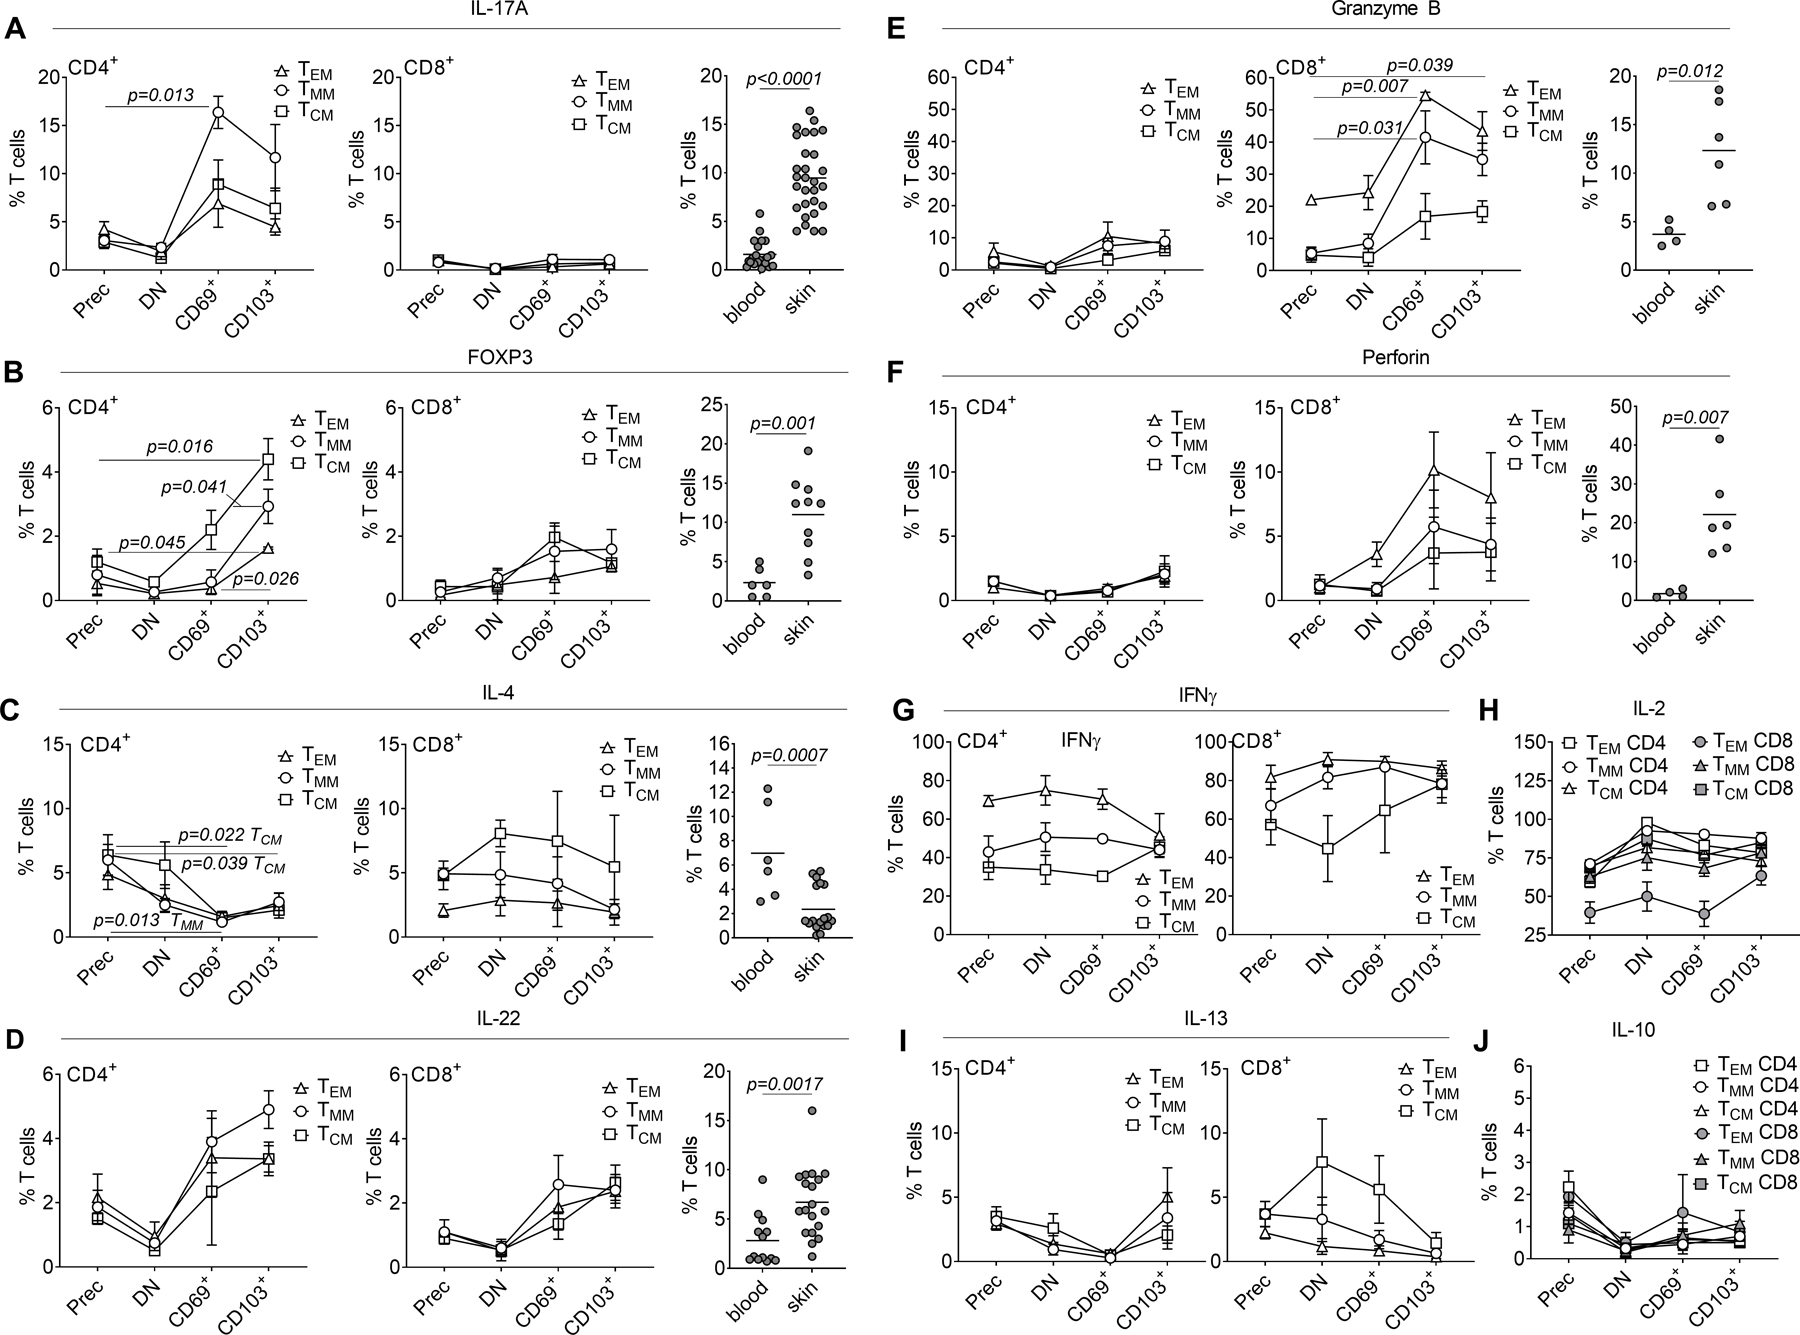
Figure 3. Acquisition of TRM markers is accompanied by changes in T cell function.

Mass cytometry was utilized to compare production of cytokines and expression of FOXP3 in freshly isolated precursor T cell populations (Prec), vs. double negative (DN) CD69− CD103− T cells, single positive CD69+ CD103− (CD69+) and CD103+ (CD103+) T cells isolated after 1 day bead stimulation and 7 days of culture on keratinocyte monolayers. (A-J) Expression of the indicated cytokines is shown in each population, with comparisons to expression in blood CLA+ skin tropic T cells and T cells from healthy skin (A-F). The mean and SEM of mass cytometry results from three separate donors are shown. Significance was determined by a one-way ANOVA and Tukey’s post-hoc test for multiple comparisons (mass cytometry) or by two-tailed T-tests (flow cytometry studies of blood vs. skin).
