

Abstract
The central nucleus of the amygdala (CeA) is a critical brain region in the integration of emotional behaviors and is one of the major output areas of the amygdaloid complex. The CeA is composed of GABAergic interneurons and projection neurons which co-express a range of peptides including neuropeptide Y (NPY). Importantly, GABA and NPY signaling, via the NPY Y1 receptor (Y1R), in the CeA modulate binge-like ethanol intake in rodents and these systems undergo neuroplastic alterations following a history of ethanol consumption. Here we assessed the roles of GABAergic and Y1R+ circuits arising from the CeA and innervating the lateral habenula (LHb), a brain region that modulates the aversive properties of ethanol, in modulating binge-like ethanol intake in mice using “drinking in the dark” (DID) procedures. Using an anterograde cre-inducible reporter virus we established the CeA → LHb circuit in male and female vgat-ires-cre and NPY1r-cre mice. Next, we found that chemogenetic silencing of both the GABAergic or Y1R+ CeA → LHb circuit significantly blunted binge-like intake of a 20% ethanol solution but this same procedure failed to alter the consumption of a 3% sucrose solution. Finally, one, 4-day cycle of DID failed to alter basal or effects of ethanol or NPY on inhibitory transmission in Y1R+ CeA → LHb neurons. The present results suggest that blunting GABAergic tone in LHb-projecting CeA neurons may represent a new approach to preventing the development of AUDs. Drugs that target NPY Y1Rs are potential attractive targets.
Keywords: Ethanol, NPY, Y1 receptor, GABA, Binge-like ethanol drinking, Central amygdala, Lateral habenula
1. Introduction
Excessive alcohol (ethanol) use is associated with numerous health and economic risks [1], and is prevalent across different age groups and populations [1–3]. One of the most common forms of excessive ethanol intake is coined binge drinking, defined as consuming enough ethanol within a two-hour timeframe to reach or exceed a blood ethanol concentration (BEC) of greater than 0.08% (80 mg/dL) [4]. Of all the patterns of ethanol intake associated with alcohol use disorders (AUDs), binge drinking produces the greatest economic burden, accounting for over 75% of the annual economic costs which include medical expenses and lost work time [5]. In order to study the neurobiological mechanisms underlying voluntary binge-like ethanol drinking, “drinking-in-the-dark” (DID) procedures were developed using C57BL/6 J mice [6,7]. This preclinical model of voluntary ethanol drinking has become widely used in neuroscience research to study the neuronal mechanisms associated with binge-like ethanol consumption [8].
The central nucleus of the amygdala (CeA) is the major output for the amygdala complex and is composed primarily of GABAergic projection and interneurons that co-express a vast array of neuropeptides [9,10]. Importantly, the CeA is a critical brain region in modulating neurobiological responses to ethanol [11,12]. For example, previous research has shown that ethanol increases GABA signaling from pre- and postsynaptic sites within the CeA [13]. This same group has also found that GABA transmission is increased following chronic ethanol exposure in an ethanol-dependent rat model [14]. Since the CeA is the major output nucleus of the amygdala, and given the critical role of GABAergic CeA neurons in modulating neurobiological responses to ethanol, it is important to understand how the GABAergic output circuits from the CeA and their downstream targets modulate binge-like ethanol intake.
One peptide co-expressed with GABA in the CeA is neuropeptide Y (NPY), a 36-amino acid molecule that is one of the most abundant peptides in the central nervous system (CNS) and predominantly expressed within GABAergic interneurons [15]. NPY is the anxiolytic counterpart to the anxiogenic neuropeptide, corticotropin releasing factor (CRF), and modulates anxiolytic effects through binding-interaction with the Y1 receptor (Y1R) [16–18]. Furthermore, NPY exerts a neuroprotective mechanism against ethanol consumption by reducing drinking and reducing GABAergic transmission [11,19–21]. The protective effect of NPY on ethanol intake results from signaling in brain regions that regulate emotions and stress but has an opposite effect on ethanol intake in hypothalamic areas linked to feeding behavior [22–24]. Thus, NPY signaling within the CeA decreases responding for, and consumption of, ethanol [19,25,26]. NPY has also been seen to oppose the effects of chronic ethanol exposure and block the transition to dependence by reversing alcohol-induced enhancement of inhibitory transmission in the CeA [11].
The lateral habenula (LHb) is a highly conserved region of the vertebrate brain and has been implicated in modulating affective disorders and depressive behavior [27–30]. The LHb is also important in modulating avoidance and anti-reward behaviors [31]. In relation to ethanol, high-frequency stimulation of this region reduces voluntary ethanol consumption [32]. Furthermore, ethanol has been found to potentiate GABAergic transmission in the LHb, direct evidence that the LHb modulates neurobiological responses to ethanol [33]. Interestingly, a subpopulation of GABAergic neurons expressing somatostatin (SOM) in the CeA were found to send projections to the LHb and the SOM+ CeA → LHb circuit was found to modulate chronic pain and the depressive-like behavior associated with this pain [34]. Using a combination of cre-transgenic mice and cre-dependent anterograde reporters, here we confirm that the CeA → LHb circuit is GABAergic and involves NPY and Y1R.
The experiments that follow were designed to explore the role of GABAergic- and NPY1R-expressing LHb-projecting CeA neurons in binge-like ethanol consumption. Chemogenetic modulation of CeA terminals, through the use of inhibitory designer receptors exclusively activated by designer drugs (DREADDs) in tandem with cre-line transgenic mice allowed us to demonstrate that inhibition of both GABAergic or NPY1R-expressing (Y1R+) neurons in the CeA → LHb circuit blunts binge-like consumption of 20% ethanol. In order to determine specificity of this effect, we also measured intake of 3% sucrose during inhibition of these populations. In contrast to ethanol, there was no significant change in sucrose consumption when these circuits were silenced. To begin to uncover how this binge-like drinking paradigm might alter the inhibitory control of these neurons we used electrophysiological wholecell recordings of baseline spontaneous inhibitory postsynaptic currents (sIPSCs) followed by in vitro exposure to ethanol or NPY. There were no significant differences between sIPSCs of ethanol and water drinking animals. There was also no effect of 44 mM ethanol nor 500 nM NPY on inhibitory control of these cells and no differences in changes from baseline measurements between drinking groups following ethanol or NPY exposure.
2. Methods
2.1. Animals
Male and female vgat-ires-cre mice were backcrossed onto a C57BL/6 J strain (Jackson Laboratories, Bar Harbor, ME) and were obtained from Dr. Bradford Lowell [35]. Male and female NPY1r-cre mice were backcrossed onto a C57BL/6 J strain and were obtained from Dr. Richard Palmiter [36]. All animals were individually housed following surgical procedures with ad libitum access to water and Prolab® RMH 3000 (Purina labDiet®; St. Louis, MO). The animal vivarium was maintained at 22°C on a 12:12 h reverse light/dark cycle. All protocols were conducted under National Institute of Health guidelines and were approved by the University of North Carolina Institutional Animal Care and Use Committee.
2.2. Surgical procedures
Mice were anesthetized via an intraperitoneal (i.p.) ketamine (66.7 mg/kg; Henry Schein, Dublin, OH) and xylazine (6.67 mg/kg; Henry Schein) cocktail. The analgesic meloxicam (Sigma-Aldrich, St. Louis, MO) was administered at (0.1 mL/10 g) via i.p. injection before surgical procedure. A 1% lidocaine HCl (Hospira, Inc., Lake Forest, IL) volume of 0.1 mL was subcutaneously applied above the skull. Mice received bilateral infusions of 0.5 μL of inhibitory the DREADD, AAV8-hSyn-DIO-hM4d(Gi)-mcherry (6 × 10¹² vg/mL; Addgene, Cambridge, MA, USA), or control vector without the DREADD construct, AAV8-hSyn-DIO-mcherry (8 × 10¹² vg/mL; Addgene, Cambridge, MA, USA), targeting the CeA (from bregma AP: −1.06, ML: −2.61, DV: −4.71). During the same surgical procedure, a bilateral cannula unit (Plastics One, Virginia, USA) was implanted targeting the LHb (from bregma AP: −1.94, ML: −0.5, DV: −2.5). For the circuitry mapping study mice were given an injection of a AAV5/EF1aDio-hChR2-eYFP virus into the CeA of vgat-ires-cre or an injection of AAV5/EF1aDio-hChR2-mCherry virus into the CeA of NPY1r-cre (using coordinates above) as we find this to be an excellent method for anterograde pathway mapping. For electrophysiological studies, mice received bilateral infusions of 0.5 μL of AAV8-hSyn-DIO-hM4d(Gi)-mcherry (6 × 10¹² vg/mL; Addgene, Cambridge, MA, USA) targeting the CeA (from bregma AP: −1.06, ML: −2.61, DV: −4.71) and 0.2 μL bilateral infusions of the retrograde reporter virus (pAAV-hSyn-EGFP; Addgene, Cambridge, MA, USA) targeting the LHb (from bregma AP: −1.94, ML: −0.5, DV: −2.5). Animals underwent at least 3 weeks of recovery and viral incubation before the beginning of behavioral procedures with ad libitum access to water and food.
2.3. Drinking-in-the-dark (DID) procedures
A detailed description of the binge-like, voluntary consumption paradigm is described in previous research [7]. Briefly, DID is a 4-day paradigm where typical mouse water bottles were replaced 3-hours into the 12-hr dark cycle with a modified 10 mL pipette filled with 20% (v/v) ethanol solution. After a 2-hour timeframe, ethanol bottles were removed, and typical bottles with tap water were returned. On test day (fourth day) experimental manipulation occurred ~30 min before access to ethanol solution. Following 2 h access on test day, ethanol bottles were removed, and the lateral vein was utilized to collect approximately 30 μL of tail-blood from each mouse for assessment of blood ethanol concentrations (BECs) using an Analox Analyzer (Analox Instruments, Lunenburg, MA, USA). During this paradigm mice typically reach or exceed binge-level BECs as defined by the NIAAA, 80 mg/dl [7].
2.4. Chemogenetic inhibition of LHb-projecting GABAergic/Y1R-expressing CEA neurons
A schematic of the experimental procedures for chemogenetic studies is shown in Panel A of Fig. 1. Following 3 to 4 weeks of recovery and virus transduction, animals were cycled through two consecutive DID cycles with 20% ethanol solution. Animals were habituated to handling on day 2 and 3 of drinking before testing and received mock saline injections on day 3 to habituate to microinfusions. On test days (fourth day), ~30 min prior to ethanol consumption, mice were microinfused into bilateral cannula targeting the LHb with vehicle (saline+1% DMSO; 0.3 μL/1 min infusion/hemisphere) or CNO (900 pmol/0.3 μL/1 min infusion/hemisphere; dosed based on our lab’s previous work [37]. Microinfusions were completed using a Hamilton syringe (Reno, NV) in combination with a Harvard Apparatus PHD 2000 infusion pump (Holliston, MS). Mice were counter-balanced and distributed to groups based on consumption levels observed during the first 3-days of access during the DID cycle into vehicle or CNO groups to ensure equal average consumption baselines between the two groups. During the second DID cycle, mice received the opposite drug treatment relative to the first cycle creating a counter-balanced Latin square design and allowing each animal to serve as its own control group. Following ethanol testing, 1-week of recovery was allowed before an additional 2-weeks of DID cycle testing with 3% sucrose solution to determine if chemogenetic manipulation of these circuits was specific to ethanol consumption.
Fig. 1.

Experimental timelines for chemogenetic studies involving “drinking in the dark” (DID) procedures (Panel A) and for the electrophysiological experiment (Panel B).
2.5. DREADD and cannula placement verification
At the completion of the study, mice received administration of a 0.1 mL i.p. ketamine/xylazine (6.67 mg/0.1 mL; 0.67 mg/01. mL; in 0.9% saline) and were transcardially perfused with 0.1 M phosphatebuffered saline (PBS) followed by 4% paraformaldehyde in PBS (pH = 7.4) using a Masterflex L/S perfusion pump (catalog #7200–12, Cole-Parmer, Vernon Hills, IL). After extraction, tissue was post-fixed in 4% paraformaldehyde for 24 h. Brains were sectioned into 40 μm slices via vibratome (model VT1000 S, Leica Biosystems, Buffalo Grove, IL). Tissue was placed in cryopreserve and stored in a − 20 °C freezer until use.
2.6. Electrophysiological recordings
A schematic of the experimental procedures for the electrophysiological study is shown in Panel B of Fig. 1. Animals were taken for tissue processing and recording directly after access to EtOH solution on the final day of the 4-day DID procedure. Slice preparation and electrophysiological recording were completed following previously-described methods [38]. In brief, 300 μm coronal slices containing the CeA were continuously bath perfused at a rate of 2 mL/min with a room-temperature oxygenated (95% O2/5% CO2) artificial cerebrospinal fluid (aCSF) containing the following (in mM): NaCl 130; KCL 3.5; CaCl2 2.0; Glucose 10; MgSO4–7H2O 1.5; NaH2PO4-H2O 1.25; NaHCO3 24. Whole cell voltage- and current-clamp recordings, made with a Multiclamp 700B amplifier and stored on a PC using pClamp 10, were made in neurons in the medial CeA that contained Cre labeling a NPY1R+ phenotype and that are identified as projecting to the LHb with retro AAV labeling. Membrane properties were determined in voltage clamp after which current clamp (I = 0) configuration was used to determine resting membrane potential. Synaptic transmission was measured by spontaneous inhibitory postsynaptic currents (sIPSCs) recorded in the presence of glutamate and GABAB receptor antagonists (CNQX, 10 μM; APV-5, 30 μM; CGP55845A, 1 μM), to isolate GABAA receptor currents. Patch pipettes (5–7 MΩ) were filled with an intracellular solution containing (in mM): potassium chloride (KCl) 145; EGTA 5; MgCl2 5; HEPES 10; Na-ATP 2; Na-GTP 0.2 (for voltage-clamp recordings of sIPSCs). Neurons were then introduced to 44 mM Ethanol via y-tube application for rapid local perfusion as previously described [38,39] and IPSCs were assessed. A 10 min washout followed and then a subset of neurons were tested using y-tube application of 500 nM NPY [17].
2.7. Data analysis
Data were analyzed using analysis of variance (ANOVA) with sex, virus condition, and drug order as between-subjects factors and drug treatment (vehicle vs. CNO) as a within-subjects factor. For simplicity we focus statistical reporting on drug treatment and the interactions of the other variable swith drug treatment. However, any significant main effects that were observed are also reported. Paired t- tests were used as planned comparisons. Analyses were performed in SPSS 25 (IBM Analytics, Armonk, New York) and GraphPad Prism 9 (La Jolla, CA). Data are presented as mean ± standard error of the mean (SEM) and were considered significant if p < 0.05 (two-tailed). For electrophysiological studies, frequency, amplitude, rise, and decay of sIPSCs were analyzed using MiniAnalysis Synaptosoft (San Jose, CA) software. Responses were quantified as the difference between baseline currents and currents under experimental conditions. Baseline and experimental currents were assessed from stable recording periods containing a minimum of 60 events or analysis period of 3–5 min. Events were analyzed for significance using a one-sample t-test and compared using unpaired, two-tailed t-test for independent samples and paired, two-tailed t-test for within subject samples. Data are presented as mean ± SEM and considered significant if p < 0.05 (two-tailed).
3. Results
3.1. Effects of chemogenetic silencing of GABAergic CeA → LHb circuit on binge-like ethanol intake and sucrose drinking in vgat-ires-cre mice
3.1.1. Binge-like ethanol intake and BECs
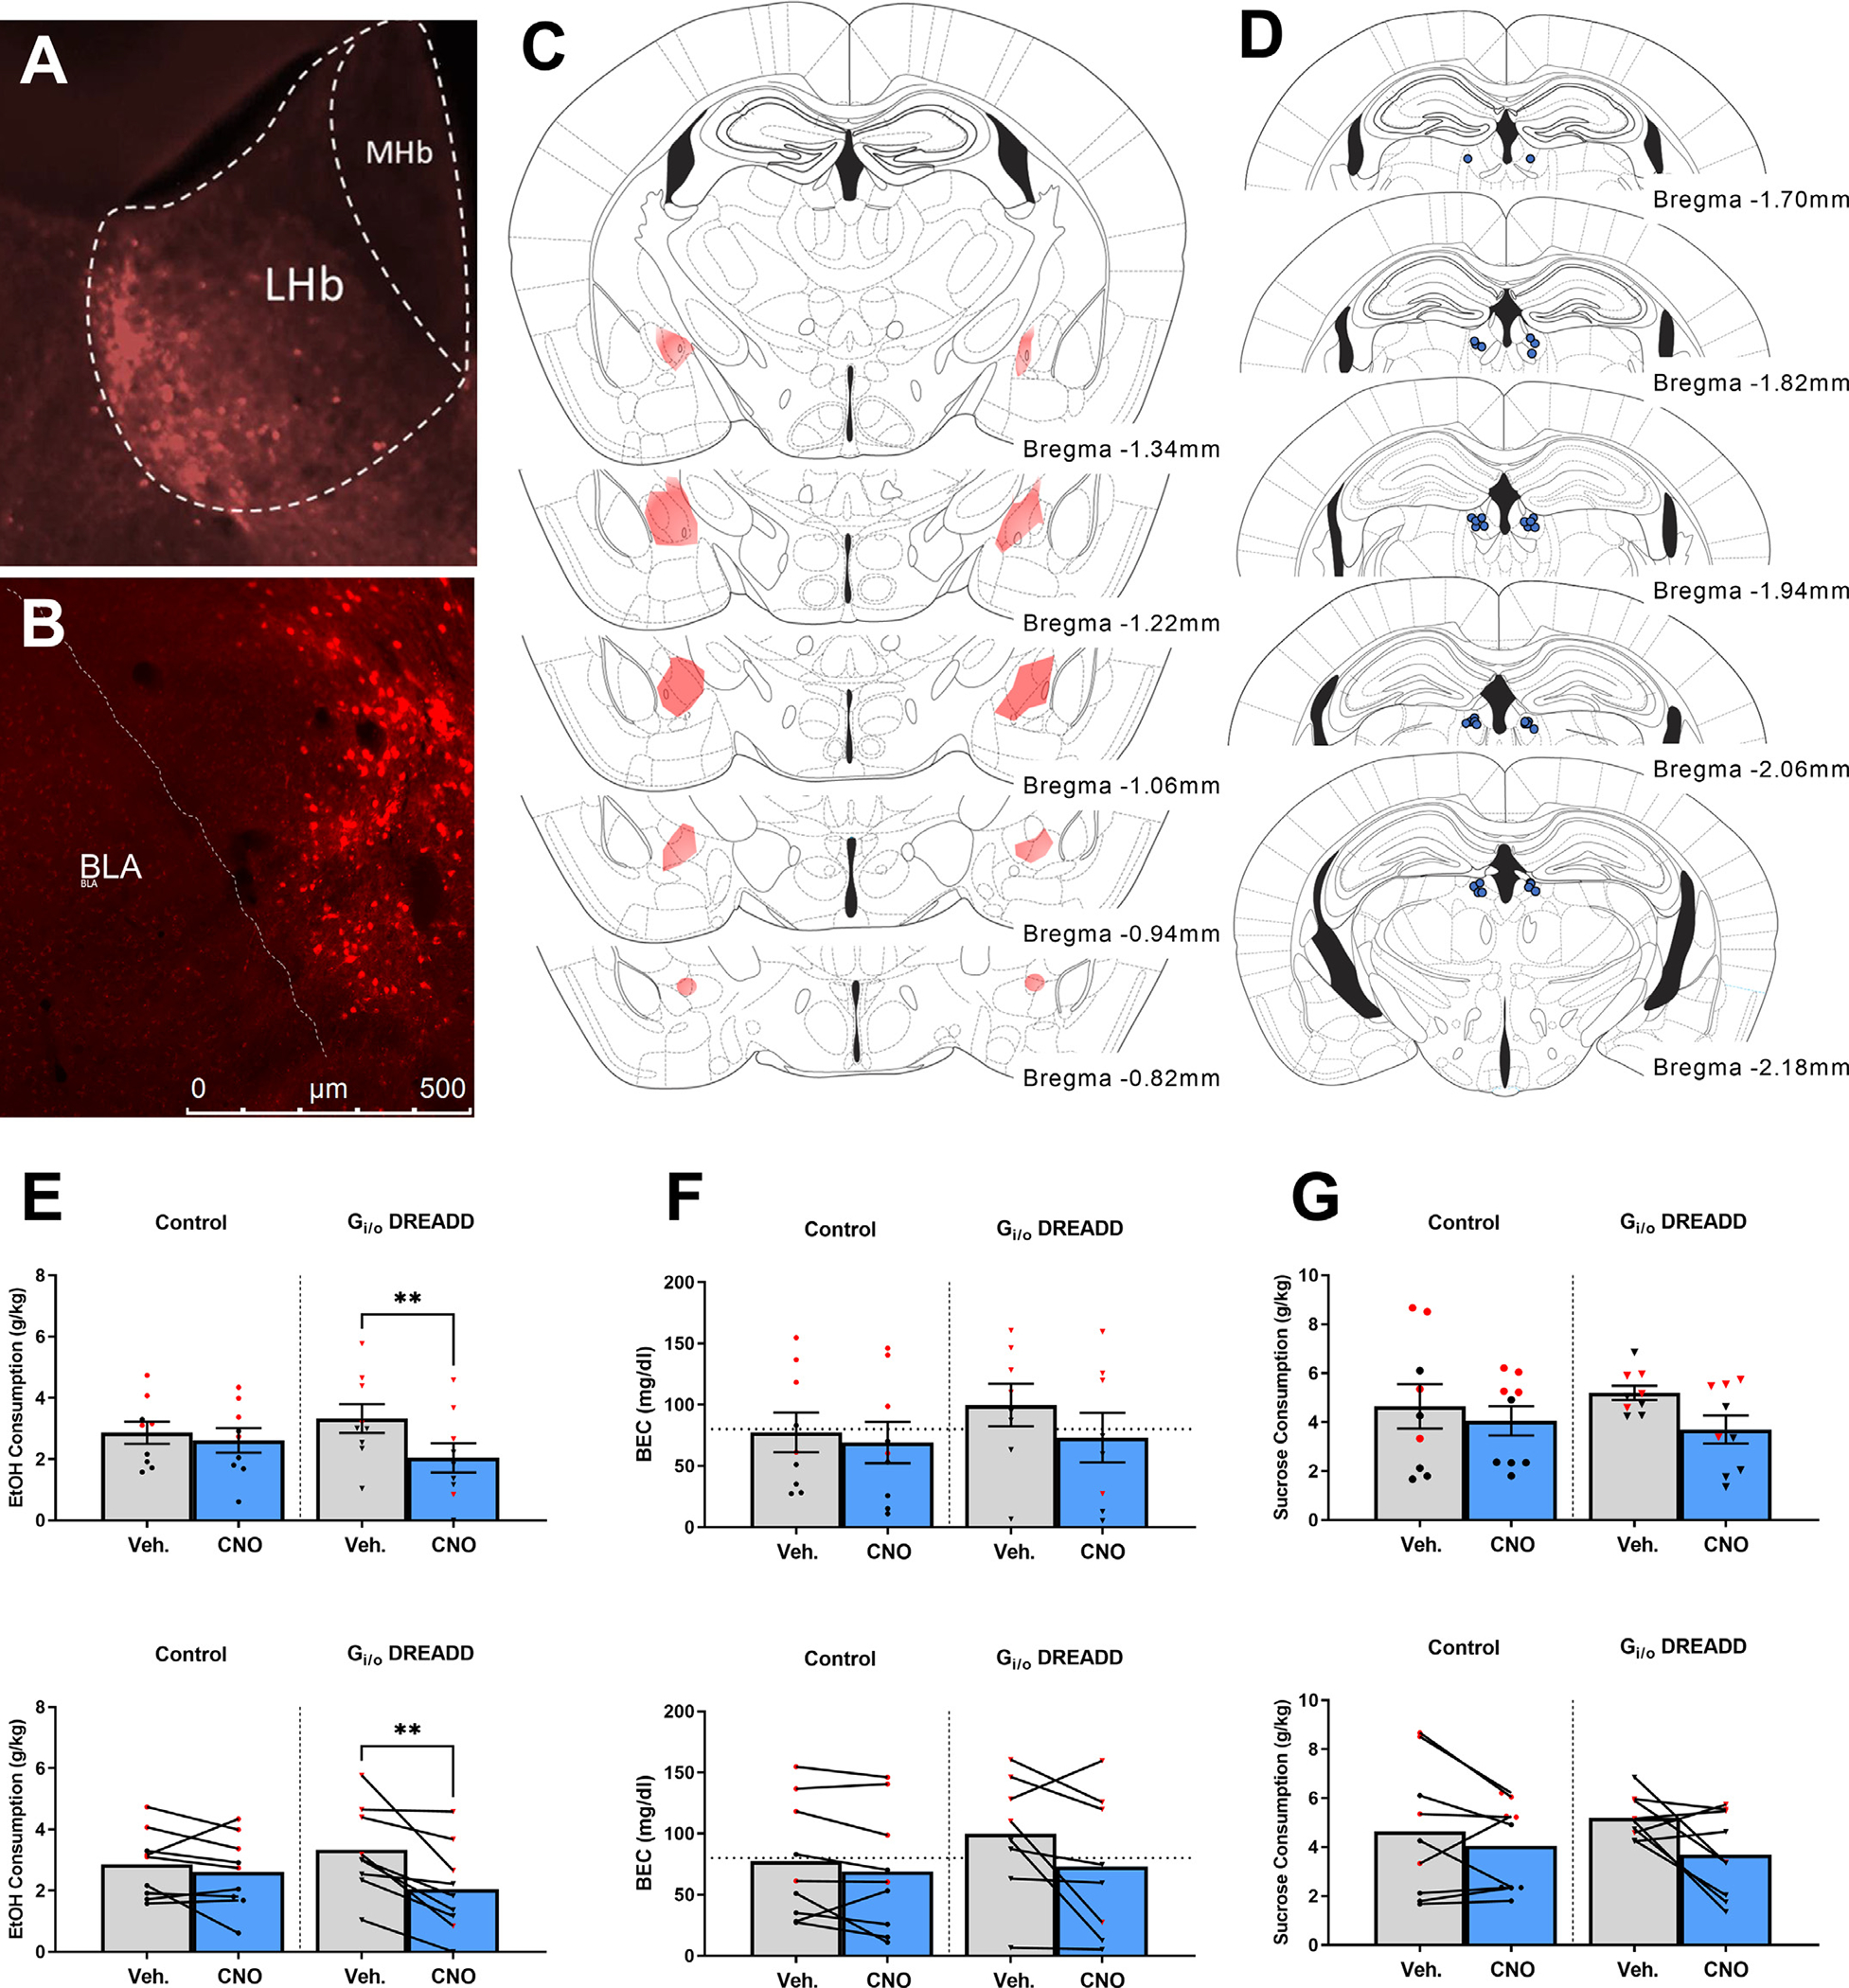
Fig. 2A showing AAV5/EF1aDio-hChR2-eYFP expression of CeA terminals in the LHb of vgat-ires-cre mice, confirming the GABAergic CeA → LHb circuit. Fig. 2B depicts representative Gi/oDREADD expression in the CeA. Fig. 2C shows heat maps of virus expression in the CeA and Fig. 2D shows locations of cannulae placements. Ethanol consumption, BEC, and sucrose consumption data are presented in Figs. 2E–G. In Fig. 2E–G the top row presents data as mean ± SEM along with individual data points and the bottom row is presented such that each subject’s data points following vehicle or CNO infusion are connected. Analysis of data from Fig. 2E revealed a significant interaction of drug treatment and virus [F(1,17)=5.026, p = 0.040] while no other effects were statistically significant [treatment: F(1,16)=3.159, p = 0.095; treatment*sex interaction: F(1,16)=0.471, p = 0.503; treatment*drug-order interaction: F(1,16)=0.119, p = 0.773]. Planned comparisons between vehicle and CNO treatment was significant in mice expressing the Gi/oDREADD [t(9)=5.938, p = 0.0001] but not in mice expressing the control viral vector [t(9)=0.5759, p = 0.5788].
Fig. 2.

DREADD-driven inhibition of LHb-projecting CeA GABAergic neurons blunts binge-like ethanol consumption in male and female vgat-ires-cre mice but not consumption of sucrose. Panel A shows AAV5/EF1aDio-hChR2-mCherry expression of CeA terminals in the LHb of vgat-ires-cre mice. Panel B shows cre-driven Gi/oDREADD expression in the CeA of a vgat-ires-cre mouse. C. Placement maps showing approximate DREADD viral spread. D. LHb cannula placements within vgat-ires-cre mice. E. CNO, not vehicle, microinfused into the LHb blunted binge-like ethanol consumption in animals with Gi/oDREADD viral vector (n = 10; male n = 7 and female n = 3) but the not control virus (n = 10; male n = 6 and female n = 4). F. BECs were also blunted in the CNO-treated Gi/oDREADD group (n = 10; male n = 7 and female n = 3) and not in the control vector (n = 10; male n = 5 and female n = 4). G. CNO microinfusion failed to alter binge-like consumption in Gi/oDREADD vector group (n = 10; male n = 7 and female n = 3) and control virus group (n = 10; male n = 6 and female n = 4). For panels E-G, the top row presents data as mean ± SEM along with individual data points and the bottom row is presented such that each subject’s data points following vehicle or CNO infusion are connected. Black data points represent male mice and red data points represent female mice. *** indicates p<0.001 and **** indicates p<0.0001 paired t-test (two-tailed). Data collapsed across sexes due to absence of statistically significant sex differences. Data are presented as mean ± SEM.
There was one blood sample that was lost in processes and thus there is one less data point for BEC data relative to the behavioral data. Analyses of data from Fig. 2F revealed a significant drug treatment main effect [F(1,15)=6.033, p = 0.027] and the virus *treatment interaction approached significance [F(1,15)=4.226, p = 0.058]. No other effects were significant [treatment*sex interaction: F(1,15)=0.140, p = 0.714; treatment*drug-order interaction: F(1,15)=0.427, p = 0.523]. Planned comparisons between vehicle and CNO treatment was significant in mice expressing the Gi/oDREADD [t(9)=5.419, p = 0.0004] but not in mice expressing the control viral vector [t(8)=0.5904, p = 0.5712].
3.1.2. Sucrose intake
Sucrose consumption data are presented in Fig. 2G. The top figure presents data as mean ± SEM along with individual data points and the bottom figure is presented such that each subjects data points following vehicle or CNO infusion are connected. There was no significant effect of treatment nor interaction of treatment with any factor [treatment: F(1,16)=4.107, p = 0.60; treatment*drug-order interaction: F(1,16)=1.729, p = 0.207; treatment*sex interaction: F(1,16)=0.084, p = 0.776; treatment*virus interaction: F(1,16)=0.455, p = 0.509]. There were, however, significant main effects of sex [F(1,16)=6.983, p = 0.018] reflecting higher sucrose intake by female mice and a significant virus main effect [F(1,16)=5.273, p = 0.036].
3.2. Effects of chemogenetic silencing of Y1R+ CeA → LHb circuit on binge-like ethanol intake and sucrose drinking in NPY1r-cre mice
3.2.1. Binge-like ethanol intake and BECs
Fig. 3A showing AAV5/EF1aDio-hChR2-mCherry expression of CeA terminals in the LHb of NPY1r-cre mice, confirming the Y1R+ CeA → LHb circuit. Fig. 3B depicts representative Gi/oDREADD expression in the CeA. Heat maps of virus expression in the CeA and locations of cannulae placements for this study are depicted in Fig. 3C and 3D respectively, while ethanol consumption, BEC data, and sucrose intake are presented in Figs. 3E–G. In Fig. 3E–G the top row presents data as mean ± SEM along with individual data points and the bottom row is presented such that each subject’s data points following vehicle or CNO infusion are connected. Analysis of data from Fig. 3E revealed a treatment main effect [F(1,13)=6.722, p = 0.022] and significant interaction of drug treatment and virus [F(1,13)=5.662, p = 0.033] but no other effects were significant [treatment*drug-order: F(1,13)=0.481, p = 0.50; treatment*sex: F(1,13)=0.000, p = 0.995]. Planned comparisons show a significant difference between vehicle and CNO treatment in the Gi/oDREADD group [t(8)=4.025, p = 0.0038] but not within the control virus group [t(8)=0.9741, p = 0.3585] There is also a significant main effect of sex [F(1,13)=17.992, p<0.001] reflecting higher ethanol intake in female mice.
Fig. 3.
DREADD-driven inhibition of LHb-projecting CeA Y1R+ neurons blunts binge-like ethanol consumption but not binge-like consumption of sucrose in NPY1r-cre mice. Panel A shows AAV5/EF1aDio-hChR2-eYFP expression of CeA terminals in the LHb of NPY1r-cre mouse. Panel B shows cre-driven Gi/oDREADD expression in the CeA of a NPY1r-cre mouse. C. Placement maps showing approximate DREADD viral spread. D. LHb cannula placements within NPY1r-cre mice. E. CNO, not vehicle, microinfused into the LHb blunted binge-like ethanol consumption in animals with Gi/oDREADD viral vector (n = 9; male n = 5 and female n = 4), and not control virus (n = 9; male n = 5 and female n = 4). F. BECs were not significantly altered in the CNO-treated Gi/oDREADD group (n = 9; male n = 5 and female n = 4) nor the control vector (n = 9; male n = 5 and female n = 4). G. CNO microinfusion failed to alter binge-like consumption of 3% sucrose in Gi/oDREADD vector group (n = 9; male n = 5 and female n = 4) and control virus group (n = 9; male n = 5 and female n = 4). For panels E-G, the top row presents data as mean ± SEM along with individual data points and the bottom row is presented such that each subjecťs data following vehicle or CNO infusion are connected. Black data points represent male mice and red data points represent female mice. ** indicates p<0.01 paired t-test (two-tailed). Data are presented as mean ± SEM.
BEC data are presented in Fig. 3F. There were no statistical differences in BEC levels [treatment: F(1,13)=1.742, p = 0.210; treatment*drug-order: F(1,13)=0.004, p = 0.953; treatment*virus: F(1,13)=2.168, p = 0.165; treatment*sex: F(1,13)=2.165, p = 0.165]. There was a significant main effect of sex, which is due to the higher BECs within female subjects [sex: F(1,13)=18.500, p<0.001].
3.2.2. Sucrose intake
Sucrose consumption data are presented in Fig. 3G. The top graph of the panel presents data as mean ± SEM along with individual data points and the bottom graph is presented such that each subjects data points following vehicle or CNO infusion are connected. There was no significant effect of treatment, nor any treatment interaction on binge-like consumption of 3% sucrose [treatment: F(1,13)=1.262, p = 0.282; treatment*drug-order: F(1,13)=0.323, p = 0.580; treatment*virus: F(1,13)=1.519, p = 0.240; treatment*sex: F(1,13)=0.333, p = 0.574]. There is a significant main effect of sex [F(1,13)=11.208, p = 0.005], reflecting higher levels of sucrose intake by female mice.
3.3. Effects of one, 4-day DID session on inhibitory transmission in Y1R+ CeA neurons projecting to the LHb
3.3.1. Baseline inhibitory transmission
Fig. 4A is a representative image of a CeA section with recording pipette and y-tube placement along with embedded representative CeA neuron and dual mCherry and eGFP expression. Panel B in same figure shows a representative baseline sIPSC trace of both water and ethanol drinking groups. Fig. 4C is a table of water and ethanol drinking group membrane properties. There were no significant differences in membrane capacitance, membrane resistance or resting membrane potential between water and ethanol drinking groups, with the exception of decay tau, which was significantly greater in the ethanol drinking group. Fig. 4D–G shows no difference between water and ethanol drinking groups in sIPSC frequency [t(16)=0.2516,p = 0.8046], amplitude [t(16)=0.7148, p = 0.4850], rise [t(16)=0.0.300, p = 0.9764], nor decay [t(16)=0.4139,p = 0.6844] respectively. All data as presented as mean ± SEM.
Fig. 4.

One, 4-day cycle of binge-like ethanol consumption did not significantly alter baseline inhibitory currents in Y1R+ LHb-projecting CeA neurons compared to water controls. Panel A depicts representative image of slice with recording pipette and y-tube placement, along with representative cell body and dual labeling of cre-dependent mCherry and retrograde eGFP. Panel B shows representative sIPSC traces from ethanol and water drinking groups. Panel C shows a table of both ethanol (cell n = 9, animal n = 5) and water (cell n = 9, animal n = 6) drinking group membrane properties. Fig. 3D–G show ethanol and water drinking group baseline sIPSC frequency, amplitude, rise, and decay respectively. Data are presented as mean ± SEM. Black data points represent male mice and red data points represent female mice.
3.3.2. Inhibitory transmission following acute ethanol exposure
Fig. 5A shows representative traces of sIPSCs of baseline and 44 mM ethanol exposure in both water and ethanol drinking groups. Fig. 5B top graph shows no significant change in frequency due to 44 mM ethanol in the water drinking [t(8)=2.162, p = 0.063] nor ethanol drinking [t(8) = 1.004, p = 0.345] groups. The bottom graph also shows no significant differences between groups with normalized data in change from baseline [t(16)=0.8373, p = 0.4147] and no significant difference from 100 with either group in a one-sample t-test [water: t(8)=1.779, p = 0.1131; ethanol: t(8) = 0.1623, p = 0.8751]. Fig. 5C top graph shows no significant change in amplitude due to 44 mM ethanol in the water drinking [t(8)=−1.176, p = 0.273] nor ethanol drinking [t(8)=0.−320, p = 0.757] groups. The bottom graph also shows no significant differences between groups with normalized data in change from baseline [t(16)= 1.032, p = 0.3174] and no significant difference from 100 with either group in a one-sample t-test [water: t(8)=1.389, p = 0.2023; ethanol: t(8)=0.3465, p = 0.7379]. Fig. 5D top graph shows no significant change in rise due to 44 mM ethanol in the water drinking [t(8)=0.1.047, p = 326] nor ethanol drinking [t(8)=0.1.565 p = 0.156] groups. The bottom graph also shows no significant differences between groups with normalized data in change from baseline [t(16)=0.1449, p = 0.8866] and no significant difference from 100 with either group in a one-sample t-test [water: t(8)=0.7366, p = 0.4824; ethanol: t(8)=1.447, p = 0.1859]. Fig. 5E top graph shows no significant change in decay due to 44 mM ethanol in the water drinking [t(8)=0.−382, p = 0.712] but a significant effect during ethanol drinking [t(8)=−2.304, p = 0.05] groups. The bottom graph also shows no significant differences between groups with normalized data in change from baseline [t(16)=0.7201, p = 0.4818] and no significant difference from 100 with either group in a one-sample t-test [water: t(8)=0.8660, p = 0.4117; ethanol: t(8)=2.135, p = 0.0653].
Fig. 5.

One, 4-day cycle of binge-like ethanol consumption did not significantly alter inhibitory current changes related to acute ethanol nor NPY exposure in Y1R+ LHb-projecting CeA neurons compared to water controls. Panel A shows representative traces of baseline sIPSCs from ethanol (cell n = 9, animal n = 5) and water (cell n = 9, animal n = 6) drinking groups. B. The top graph shows no significant change in sIPSC frequency due to 44 mM ethanol in the water or ethanol drinking groups, while the bottom graph shows no differences in normalized% change from baseline between drinking groups. C-E show these same non-significant findings for sIPSC amplitude, rise, and decay respectively. F. Representative traces of sIPSCs during baseline and during 500 nM NPY exposure from ethanol (cell n = 5, animal n = 4) and water (cell n = 4, animal n = 3) drinking groups. G. The top graph shows no significant change in sIPSC frequency due to 500 nM NPY in the water or ethanol drinking groups, while the bottom graph shows no differences in normalized% change from baseline between drinking groups. H-J show these same non-significant findings for sIPSC amplitude, rise, and decay respectively. Data are presented as mean ± SEM. Black data points represent male mice and red data points represent female mice. * indicates p = 0.05 paired t -test (two-tailed).
3.3.3. Inhibitory transmission following exposure to NPY
Fig. 5F shows representative traces of sIPSC of baseline and 500 nM NPY ethanol exposure in both water and ethanol drinking groups. Fig. 5G top graph shows no significant change in frequency due to 500 nM NPY in the water drinking [t(3)=0.814, p = 0.475] nor ethanol drinking [t(4)=1.367, p = 0.244] groups. The bottom graph also shows no significant differences between groups with normalized data in change from baseline [t(7)=0.6114, p = 0.5602] and no significant difference from 100 with either group in a one-sample t-test [water: t(8)=0.6507, p = 0.5616; ethanol: t(8)=1.529, p = 0.2010]. Fig. 5H top graph shows no significant change in amplitude due to 500 nM NPY in the water drinking [t(3)=0.835, p = 0.465] nor ethanol drinking [t(4)=−1.046, p= 0.355] groups. The bottom graph also shows no significant differences between groups with normalized data in change from baseline [t(7)=0.6366, p = 0.5446] and no significant difference from 100 with either group in a one-sample t-test [water: t(8)=0.2612, p = 0.8109; ethanol: t(8)=1.003, p = 0.3728]. Fig. 5I top graph shows no significant change in rise due to 500 nM NPY in the water drinking [t(3)=0.488, p = 0.659] nor ethanol drinking [t(4)=−0.029, p=0.978] groups. The bottom graph also shows no significant differences between groups with normalized data in change from baseline [t(7)=0.4103, p = 0.6938] and no significant difference from 100 with either group in a one-sample t-test [water: t(8)=0.3423, p = 0.7547; ethanol: t(8)=0.1808, p = 0.8653]. Fig. 5J top graph shows no significant change in decay due to 500 nM NPY ethanol in the water drinking [t(3)=0.653, p = 0.560] nor ethanol drinking [t(4)=−1.176, p = 0.305] groups. The bottom graph also shows no significant differences between groups with normalized data in change from baseline [t(7)=1.020, p = 0.3415] and no significant difference from 100 with either group in a one-sample t-test [water: t(8)=0.6045, p = 0.5882; ethanol: t(8)=0.8635, p = 0.4366].
4. Discussion
Here we provide novel evidence of a CeA → LHb circuit, involving GABAergic neurons and Y1R, that modulates binge-like ethanol intake in male and female mice. In the first experiment we show that chemogenetic inhibition of a GABAergic CeA → LHb circuit blunts the binge-like consumption of a 20% ethanol solution using DID procedures. Importantly, administration of CNO into the LHb blunted binge-like ethanol intake only in mice with the Gi/oDREADD construct in the CeA and not in mice with the control virus lacking the DREADD construct. This is important in light of evidence that CNO can back-metabolize to clozapine [40], and thus a lack of an effect of CNO on behavior in control mice suggests that off-target effects of CNO are unlikely and that behavioral alterations stemming from CNO administration were due to direct interaction with the Gi/oDREADD construct. Furthermore, blunted binge-like ethanol intake after silencing of the GABAergic CeA → LHb circuit was associated with a significant reduction of associated BECs, but inhibition of this circuit failed to impact consumption of a 3% sucrose solution. The latter observation suggests that the GABAergic CeA → LHb circuit specifically modulates binge-like ethanol intake but not the intake of other salient reinforcers that also are caloric. We found similar results in the second experiment in which silencing a Y1R+ CeA → LHb circuit by treatment with CNO in the LHb blunted binge-like ethanol intake (but not associated BECs) in mice expressing the Gi/oDREADD construct in the CeA but not in mice expressing the control virus, and silencing the Y1R+ CeA → LHb circuit failed to alter sucrose intake, again suggesting ethanol-specificity. Notably, the magnitude of reduced ethanol intake and BECs following silencing of GABA neurons were much stronger relative to silencing of Y1R+ neurons, which may suggest that Y1R are expressed on a subset of GABA neurons in the CeA → LHb pathway. Finally, in the third experiment we found that exposure to one, 4-day cycle of DID failed to alter inhibitory transmission in Y1R+ CeA → LHb neurons. We also found that inhibitory currents were not significantly different between the water and ethanol drinking groups during acute 44 mM ethanol exposure nor during exposure to 500 nM NPY.
The CeA serves as a major output center for the overall amygdala complex, consisting of a predominantly GABAergic neuronal population that projects to numerous other brain regions [9]. The CeA integrates emotional behaviors and is thought to be a critical brain region that undergoes neuroplastic alterations during the transition to ethanol dependence [41,42]. Specifically, ethanol enhances GABAergic transmission at both pre- and post-synaptic locations within the CeA [13], and GABA transmission within the CeA is increased in alcohol-dependent rats [14]. Interestingly, NPY opposes the actions of ethanol on GABA transmission in the CeA and blocks the transition to alcohol dependence [11]. We have found that a history of binge-like ethanol intake is associated with blunted NPY expression the CeA, which we hypothesize is part of the mechanism that contributes to ethanol dependence [19].
The habenula is one of the oldest conserved brain regions in almost all vertebrate species [27]. The habenula is part of a larger “anti-reward” circuitry and works to inhibit transmission of the major dopaminergic regions, especially the ventral tegmental area (VTA) [43,44]. The habenula consists of medial and lateral portions and has recently been linked to psychoactive disorders, such as depression and anxiety [28–30]. In particular, the lateral region of the habenula (LHb) has a strong association with anti- or negative reward processing [31]. The LHb sends glutamatergic projections to the rostromedial tegmental area (RMTg), also referred to as the tail of the VTA [45]. In turn, the RMTg sends GABAergic projection onto dopaminergic populations in the VTA and thus inhibits reward processing and promotes avoidance learning [46]. There is evidence that the LHb modulates neurobiological response to ethanol. For example, ethanol has been found to potentiate GABAergic transmission in the LHb, direct evidence that the LHb modulates neurobiological responses to ethanol [33]. Additionally, when the LHb is stimulated at a high frequency voluntary ethanol consumption is reduced [32]. Consistently, lesions of the LHb increases voluntary consumption and self-administration of ethanol, and attenuates ethanol-induced conditioned taste aversions, suggesting that the LHb influences ethanol intake by modulating the aversive properties of ethanol [47]. The LHb has also been implicated in modulating depression-like and anxiety-like behaviors stemming from ethanol withdrawal [48].
Thus, both the CeA and the LHb play established roles in modulating ethanol intake and neurobiological responses to ethanol. It is interesting to speculate on the mechanisms by which this CeA → LHb circuit modulates binge-like ethanol intake. Since ethanol enhances GABAergic transmission in the CeA, an effect that is potentiated following ethanol dependence [13,14], GABAergic projections from the CeA to the LHb would be expected to blunt the activity of glutamate neurons in the LHb, turning off this part of the “antireward” circuit and thus increasing ethanol intake by enhancing ethanol’s reinforcing properties. Consistent with this, silencing the GABAergic CeA → LHb circuit would release the LHb from inhibition, driving glutamatergic signaling that stimulates GABAergic neurons in the RMTg which in turn provides inhibitory transmission onto VTA dopamine neurons and causing blunted binge-like ethanol intake. Since Y1Rs are expressed on GABAergic neurons in the CeA [49], this same mechanism would explain the impact of silencing Y1R+ neurons in the CeA → LHb circuit on binge-like ethanol intake. The schematic in Fig. 6 provides a representation of the effect of silencing the circuits under investigation on the proposed downstream signaling pathway. Interestingly, since Y1R are Gi-protein coupled [50], it is possible that the protective effects of CeA-administered NPY and viral-mediated overexpression of NPY in the CeA against ethanol intake [11,25,26] are produced by Y1R-mediated inhibition of GABAergic neurons, in part, associated with the CeA → LHb pathway.
Fig.6.

Schematic of the proposed circuit under investigation. Chemogenetic “silencing” of GABAergic/Y1R+ neurons from the central nucleus of the amygdala (CeA) that innervate the lateral habenula (LHb) theoretically release glutamate neurons of the LHb from inhibition. Next, activation of LHb glutamate neurons that innervate the rostromedial tegmental nucleus (RMTg) activate ventral tegmental area (VTA)-projecting GABAergic neurons, theoretically providing inhibition onto dopamine neurons with the net effect of blunting binge-like ethanol intake.
While we did not see any differences in inhibitory transmission in these Y1R+ projection neurons, here animals only went through one, 4-day cycle of DID exposure before electrophysiological recordings. Since we have previously shown that the ability of NPY to inhibit GABAergic transmission in the CeA is augmented following three, 4-day cycles of DID exposure [19], it is possible that one, 4-day exposure to DID was not sufficient to induce plasticity in the present experiment. Furthermore, since we previously recorded from a general population of neurons in the CeA [19] and not specifically from Y1R+ CeA neurons that project to the LHb, our previous results may have sampled, at least in part, a different population of neurons than were sampled in the present study. Future studies are required to determine if plasticity occurs in the Y1R+ CeA → LHb circuit following exposure to repeated cycles of DID.
While we did not observe sex interactions with chemogenetic manipulations, in the experiment vgat-ires-cre mice females consumed more sucrose solution relative to males. Furthermore, in the study involving NPY1r-cre mice, females consumed more ethanol, exhibited higher BECs, and drank more sucrose solution relative to males. These observations are consistent with a large body of data in which female rodents typically ingest more ethanol and sucrose solution than their male counterparts [51–53]. The fact that there was no interaction of sex with our chemogenetic manipulations suggest that the GABAergic and Y1R+ CeA → LHb circuit is a critical player in modulating binge-like ethanol intake in both male and female mice.
There are several other limitations to address in addition to those noted above. First, the number of neurons sampled in the electrophysiological experiment may have been too few to offer sufficient power to detect the effects of ethanol and NPY administration, in addition to potential sex differences, on dependent measures. Further, mice were exposed to only one, 4-day DID cycle prior to harvesting brains in the electrophysiological experiment, which may have not been sufficient ethanol exposure to trigger plasticity. As noted above, future studies entailing a longer history of binge-like ethanol intake and larger sample size will allow us to address these limitations. Second, while we did not assess the effects of GABAergic receptor signaling in the LHb or Y1R signaling in the CeA on binge-like ethanol intake, such pharmacological experiments are important for a more complete characterization of the circuit under investigation and are planned for the future.
In conclusion, here we provide the first direct evidence that a CeA → LHb pathway, entailing GABA and Y1R, plays a critical role in modulating binge-like ethanol intake. Importantly, chemogenetic silencing of this pathway selectively modulated binge-like ethanol intake and did not alter the consumption of sucrose, another salient reinforcer that entails calories like ethanol. Given the role of the LHb in modulating the aversive properties of ethanol and ethanol withdrawal, future work will determine if this circuit is involved in modulating the aversive properties of ethanol by examining if silencing this pathway augments ethanol-induced conditioned taste aversions or unconditioned aversive responses [54]. The present results suggest that blunting GABAergic tone in LHb-projecting CeA neurons may represent a new approach to preventing the development of AUDs, and that drugs that target NPY Y1Rs are potential attractive targets.
Acknowledgments
This research was funded by NIH grants AA013573, AA022048, AA027134, AA026858 & AA025809.
Footnotes
CRediT authorship contribution statement
Michel A. Companion: Conceptualization, experimentation, statistical analyses, manuscript preparation. David A Gonzalez: experimentation. Stacey L. Robinson: manuscript preparation. Melissa A. Herman: Conceptualization, manuscript preparation, supervision. Todd E. Thiele: Conceptualization, manuscript preparation, supervision.
Declaration of Competing Interest
The authors declare no competing financial interests. Dr. Thiele owns shares of Glauser Life Sciences, a copy the aims to develop therapeutics for mental health disorders. The work that is presented in this paper is not directly related to the scientific aims of Glauser Life Sciences.
References
- [1].Esser MB, Sherk A, Liu Y, Naimi TS, Stockwell T, Stahre M, Kanny D, Landen M, Saitz R, Brewer RD, Deaths and years of potential life lost from excessive alcohol use - United States, 2011–2015, MMWR Morb. Mortal. Wkly. Rep. 69 (39) (2020) 1428–1433. [DOI] [PMC free article] [PubMed] [Google Scholar]
- [2].Waller M, McGuire AC, Dobson AJ, Alcohol use in the military–Associations with health and wellbeing, Subst Abuse 10 (2015) 27. [DOI] [PMC free article] [PubMed] [Google Scholar]
- [3].Rutledge PC, Bestrashniy JR, Nelson TF, Problematic drinking among postgraduate students–Binge drinking, prepartying, and mixing alcohol with energy drinks, Subst. Use Misuse 51 (8) (2016) 972–982. [DOI] [PubMed] [Google Scholar]
- [4].NIAAA. in NIAAA Newsletter Vol. 3 (2004). [Google Scholar]
- [5].Sacks JJ, Gonzales KR, Bouchery EE, Tomedi LE, Brewer RD, 2010 national and state costs of excessive alcohol consumption, Am. J. Prev. Med. 49 (5) (2015) e73–e79. [DOI] [PubMed] [Google Scholar]
- [6].Rhodes JS, Best K, Belknap JK, Finn DA, Crabbe JC, Evaluation of a simple model of ethanol drinking to intoxication in C57BL/6J mice, Physiol. Behav. 84 (1) (2005) 53–63. [DOI] [PubMed] [Google Scholar]
- [7].Thiele TE, Navarro M, Drinking in the dark” (DID) procedures–A model of binge-like ethanol drinking in non-dependent mice, Alcohol 48 (3) (2014) 235–241. [DOI] [PMC free article] [PubMed] [Google Scholar]
- [8].Sprow GM, Thiele TE, The neurobiology of binge-like ethanol drinking–Evidence from rodent models, Physiol. Behav. 106 (3) (2012) 325–331. [DOI] [PMC free article] [PubMed] [Google Scholar]
- [9].Swanson LW, Petrovich GD, What is the amygdala? Trends Neurosci. 21 (8) (1998) 323–331. [DOI] [PubMed] [Google Scholar]
- [10].Roberto M, Gilpin NW, Siggins GR, The central amygdala and alcohol–Role of gamma-aminobutyric acid, glutamate, and neuropeptides, Cold Spring Harb. Perspect. Med. 2 (12) (2012) a012195. [DOI] [PMC free article] [PubMed] [Google Scholar]
- [11].Gilpin NW, Misra K, Herman MA, Cruz MT, Koob GF, Roberto M, Neuropeptide Y opposes alcohol effects on gamma-aminobutyric acid release in amygdala and blocks the transition to alcohol dependence, Biol. Psychiatry 69 (11) (2011) 1091–1099. [DOI] [PMC free article] [PubMed] [Google Scholar]
- [12].Hyytia P, Koob GF, GABA (A) receptor antagonism in the extended amygdala decreases ethanol self-administration in rats, Eur. J. Pharmacol. 283 (1–3) (1995) 151–159. [DOI] [PubMed] [Google Scholar]
- [13].Roberto M, Madamba SG, Moore SD, Tallent MK, Siggins GR, Ethanol increases GABAergic transmission at both pre- and postsynaptic sites in rat central amygdala neurons, Proc. Natl. Acad. Sci. U. S. A. 100 (4) (2003) 2053–2058. [DOI] [PMC free article] [PubMed] [Google Scholar]
- [14].Roberto M, Madamba SG, Stouffer DG, Parsons LH, Siggins GR, Increased GABA release in the central amygdala of ethanol-dependent rats, J. Neurosci. 24 (45) (2004) 10159–10166. [DOI] [PMC free article] [PubMed] [Google Scholar]
- [15].Hokfelt T, Neuropeptides in perspective–The last ten years, Neuron 7 (6) (1991) 867–879. [DOI] [PubMed] [Google Scholar]
- [16].Valdez GR, Koob GF, Allostasis and dysregulation of corticotropin-releasing factor and neuropeptide Y systems–Implications for the development of alcoholism, Pharmacol. Biochem. Behav. 79 (4) (2004) 671–689. [DOI] [PubMed] [Google Scholar]
- [17].Kash TL, Winder DG, Neuropeptide Y and corticotropin-releasing factor bi-directionally modulate inhibitory synaptic transmission in the bed nucleus of the stria terminalis, Neuropharmacology 51 (5) (2006) 1013–1022. [DOI] [PubMed] [Google Scholar]
- [18].Heilig M, Soderpalm B, Engel JA, Widerlov E, Centrally administered neuropeptide Y (NPY) produces anxiolytic- like effects in animal anxiety models,Psychopharmacology 98 (1989) 524–529. [DOI] [PubMed] [Google Scholar]
- [19].Sparrow AM, Lowery-Gionta EG, Pleil KE, Li C, Sprow GM, Cox BR, Rinker JA, Jijon AM, Pena J, Navarro M, Kash TL, Thiele TE, Central neuropeptide Y modulates binge-like ethanol drinking in C57BL/6J mice via Y1 and Y2 receptors, Neuropsychopharmacology 37 (6) (2012) 1409–1421. [DOI] [PMC free article] [PubMed] [Google Scholar]
- [20].Thiele TE, Koh MT, Pedrazzini T, Voluntary alcohol consumption is controlled via the neuropeptide Y Y1 receptor, J. Neurosci. 22 (3) (2002) RC208. [DOI] [PMC free article] [PubMed] [Google Scholar]
- [21].Thiele TE, Marsh DJ, Ste Marie L, Bernstein IL, Palmiter RD, Ethanol consumption and resistance are inversely related to neuropeptide Y levels, Nature 396 (6709) (1998) 366–369. [DOI] [PubMed] [Google Scholar]
- [22].Ehlers CL, Li TK, Lumeng L, Hwang BH, Somes C, Jimenez P, Mathe AA, Neuropeptide Y levels in ethanol-naive alcohol-preferring and nonpreferring rats and in Wistar rats after ethanol exposure, Alcohol Clin. Exp. Res. 22 (8) (1998) 1778–1782. [PubMed] [Google Scholar]
- [23].Hayes DM, Knapp DJ, Breese GR, Thiele TE, Comparison of basal NPY and CRF levels between the high ethanol drinking C57BL/6J and low ethanol drinking DBA/2J inbred mouse strains, Alcohol Clin. Exp. Res. 29 (5) (2005) 721–729. [DOI] [PMC free article] [PubMed] [Google Scholar]
- [24].Misra K, Pandey SC, The decreased cyclic-AMP dependent-protein kinase A function in the nucleus accumbens–A role in alcohol drinking but not in anxiety-like behaviors in rats, Neuropsychopharmacology 31 (7) (2006) 1406–1419. [DOI] [PubMed] [Google Scholar]
- [25].Gilpin NW, Misra K, Koob GF, Neuropeptide Y in the central nucleus of the amygdala suppresses dependence-induced increases in alcohol drinking, Pharmacol. Biochem. Behav. 90 (3) (2008) 475–480. [DOI] [PMC free article] [PubMed] [Google Scholar]
- [26].Primeaux SD, Wilson SP, Bray GA, York DA, Wilson MA, Overexpression of neuropeptide Y in the central nucleus of the amygdala decreases ethanol self-administration in "anxious" rats, Alcohol Clin. Exp. Res. 30 (5) (2006) 791–801. [DOI] [PubMed] [Google Scholar]
- [27].Bianco IH, Wilson SW, The habenular nuclei–A conserved asymmetric relay station in the vertebrate brain, Philos. Trans. R. Soc. Lond. B Biol. Sci. 364 (1519) (2009) 1005–1020. [DOI] [PMC free article] [PubMed] [Google Scholar]
- [28].Savitz JB, Nugent AC, Bogers W, Roiser JP, Bain EE, Neumeister A, Zarate CA Jr., Manji HK, Cannon DM, Marrett S, Henn F, Charney DS, Drevets WC, Habenula volume in bipolar disorder and major depressive disorder–A high-resolution magnetic resonance imaging study, Biol. Psychiatry 69 (4) (2011) 336–343. [DOI] [PMC free article] [PubMed] [Google Scholar]
- [29].Lawson RP, Nord CL, Seymour B, Thomas DL, Dayan P, Pilling S, Roiser JP, Disrupted habenula function in major depression, Mol. Psychiatry 22 (2) (2017) 202–208. [DOI] [PMC free article] [PubMed] [Google Scholar]
- [30].Winter C, Vollmayr B, Djodari-Irani A, Klein J, Sartorius A, Pharmacological inhibition of the lateral habenula improves depressive-like behavior in an animal model of treatment resistant depression, Behav. Brain Res. 216 (1) (2011) 463–465. [DOI] [PubMed] [Google Scholar]
- [31].Proulx CD, Hikosaka O, Malinow R, Reward processing by the lateral habenula in normal and depressive behaviors, Nat. Neurosci. 17 (9) (2014) 1146–1152. [DOI] [PMC free article] [PubMed] [Google Scholar]
- [32].Li J, Zuo W, Fu R, Xie G, Kaur A, Bekker A, Ye JH, High frequency electrical stimulation of lateral Habenula reduces voluntary ethanol consumption in rats, Int. J. Neuropsychopharmacol. 19 (10) (2016) pyw050. [DOI] [PMC free article] [PubMed] [Google Scholar]
- [33].Zuo W, Wang L, Chen L, Krnjevic K, Fu R, Feng X, He W, Kang S, Shah A, Bekker A, Ye JH, Ethanol potentiates both GABAergic and glutamatergic signaling in the lateral habenula, Neuropharmacology 113 (Pt A) (2017) 178–187. [DOI] [PubMed] [Google Scholar]
- [34].Zhou W, Jin Y, Meng Q, Zhu X, Bai T, Tian Y, Mao Y, Wang L, Xie W, Zhong H, Zhang N, Luo MH, Tao W, Wang H, Li J, Li J, Qiu BS, Zhou JN, Li X, Xu H, Wang K, Zhang X, Liu Y, Richter-Levin G, Xu L, Zhang Z, A neural circuit for comorbid depressive symptoms in chronic pain, Nat. Neurosci. 22 (10) (2019) 1649–1658. [DOI] [PubMed] [Google Scholar]
- [35].Vong L, Ye C, Yang Z, Choi B, Chua S Jr., Lowell BB, Leptin action on GABAergic neurons prevents obesity and reduces inhibitory tone to POMC neurons, Neuron 71 (1) (2011) 142–154. [DOI] [PMC free article] [PubMed] [Google Scholar]
- [36].Padilla SL, Qiu J, Soden ME, Sanz E, Nestor CC, Barker FD, Quintana A, Zweifel LS, Ronnekleiv OK, Kelly MJ, Palmiter RD, Agouti-related peptide neural circuits mediate adaptive behaviors in the starved state, Nat. Neurosci. 19 (5) (2016) 734–741. [DOI] [PMC free article] [PubMed] [Google Scholar]
- [37].Rinker JA, Marshall SA, Mazzone CM, Lowery-Gionta EG, Gulati V, Pleil KE, Kash TL, Navarro M, Thiele TE, Extended amygdala to ventral tegmental area corticotropin-releasing factor circuit controls binge ethanol intake, Biol. Psychiatry 81 (11) (2016) 930–940. [DOI] [PMC free article] [PubMed] [Google Scholar]
- [38].Herman MA, Contet C, Roberto M, A functional switch in tonic GABA currents alters the output of central amygdala corticotropin releasing factor receptor-1 neurons following chronic ethanol exposure, J. Neurosci. 36 (42) (2016) 10729–10741. [DOI] [PMC free article] [PubMed] [Google Scholar]
- [39].Agoglia AE, Tella J, Herman MA, Sex differences in corticotropin releasing factor peptide regulation of inhibitory control and excitability in central amygdala corticotropin releasing factor receptor 1-neurons, Neuropharmacology 180 (2020) 108296. [DOI] [PMC free article] [PubMed] [Google Scholar]
- [40].Manvich DF, Webster KA, Foster SL, Farrell MS, Ritchie JC, Porter JH, Weinshenker D, The DREADD agonist clozapine N-oxide (CNO) is reverse-metabolized to clozapine and produces clozapine-like interoceptive stimulus effects in rats and mice, Sci. Rep. 8 (1) (2018) 3840. [DOI] [PMC free article] [PubMed] [Google Scholar]
- [41].Koob GF, Alcoholism–Allostasis and beyond, Alcohol Clin. Exp. Res. 27 (2) (2003) 232–243. [DOI] [PubMed] [Google Scholar]
- [42].Koob GF, Le Moal M, Drug addiction, dysregulation of reward, and allostasis, Neuropsychopharmacology 24 (2) (2001) 97–129. [DOI] [PubMed] [Google Scholar]
- [43].Christoph GR, Leonzio RJ, Wilcox KS, Stimulation of the lateral habenula inhibits dopamine-containing neurons in the substantia nigra and ventral tegmental area of the rat, J. Neurosci. 6 (3) (1986) 613–619. [DOI] [PMC free article] [PubMed] [Google Scholar]
- [44].Matsumoto M, Hikosaka O, Lateral habenula as a source of negative reward signals in dopamine neurons, Nature 447 (7148) (2007) 1111–1115. [DOI] [PubMed] [Google Scholar]
- [45].Hong S, Jhou TC, Smith M, Saleem KS, Hikosaka O, Negative reward signals from the lateral habenula to dopamine neurons are mediated by rostromedial tegmental nucleus in primates, J. Neurosci. 31 (32) (2011) 11457–11471. [DOI] [PMC free article] [PubMed] [Google Scholar]
- [46].Stamatakis AM, Stuber GD, Activation of lateral habenula inputs to the ventral midbrain promotes behavioral avoidance, Nat. Neurosci. 15 (8) (2012) 1105–1107. [DOI] [PMC free article] [PubMed] [Google Scholar]
- [47].Haack AK, Sheth C, Schwager AL, Sinclair MS, Tandon S, Taha SA, Lesions of the lateral habenula increase voluntary ethanol consumption and operant self-administration, block yohimbine-induced reinstatement of ethanol seeking, and attenuate ethanol-induced conditioned taste aversion, PLoS One 9 (4) (2014) e92701. [DOI] [PMC free article] [PubMed] [Google Scholar]
- [48].Kang S, Li J, Bekker A, Ye JH, Rescue of glutamate transport in the lateral habenula alleviates depression- and anxiety-like behaviors in ethanol-withdrawn rats, Neuropharmacology 129 (2018) 47–56. [DOI] [PMC free article] [PubMed] [Google Scholar]
- [49].Eva C, Mele P, Oberto A, Panzica G, Pisu MG, Serra M, Neuroanatomical and pharmacological evidence for a functional interaction between GABAergic and NPY-Y1 transmission in the amygdala of Y1R/LacZ transgenic mice, Crit. Rev. Neurobiol. 16 (1–2) (2004) 33–41. [DOI] [PubMed] [Google Scholar]
- [50].Palmiter RD, Erickson JC, Hollopeter G, Baraban SC, Schwartz MW, Life without neuropeptide Y, Recent Prog. Horm. Res. 53 (1998) 163–199. [PubMed] [Google Scholar]
- [51].Becker JB, Koob GF, Sex differences in animal models–Focus on addiction, Pharmacol. Rev. 68 (2) (2016) 242–263. [DOI] [PMC free article] [PubMed] [Google Scholar]
- [52].Lancaster FE, Gender differences in animal studies. Implications for the study of human alcoholism, Recent Dev. Alcohol 12 (1995) 209–215. [PubMed] [Google Scholar]
- [53].Wei S, Hertle S, Spanagel R, Bilbao A, Female mice are more prone to develop an addictive-like phenotype for sugar consumption, Sci. Rep. 11 (1) (2021) 7364. [DOI] [PMC free article] [PubMed] [Google Scholar]
- [54].Dornellas APS, Burnham NW, Luhn KL, Petruzzi MV, Thiele TE, Navarro M, Activation of locus coeruleus to rostromedial tegmental nucleus (RMTg) noradrenergic pathway blunts binge-like ethanol drinking and induces aversive responses in mice, Neuropharmacology 199 (2021) 108797. [DOI] [PMC free article] [PubMed] [Google Scholar]