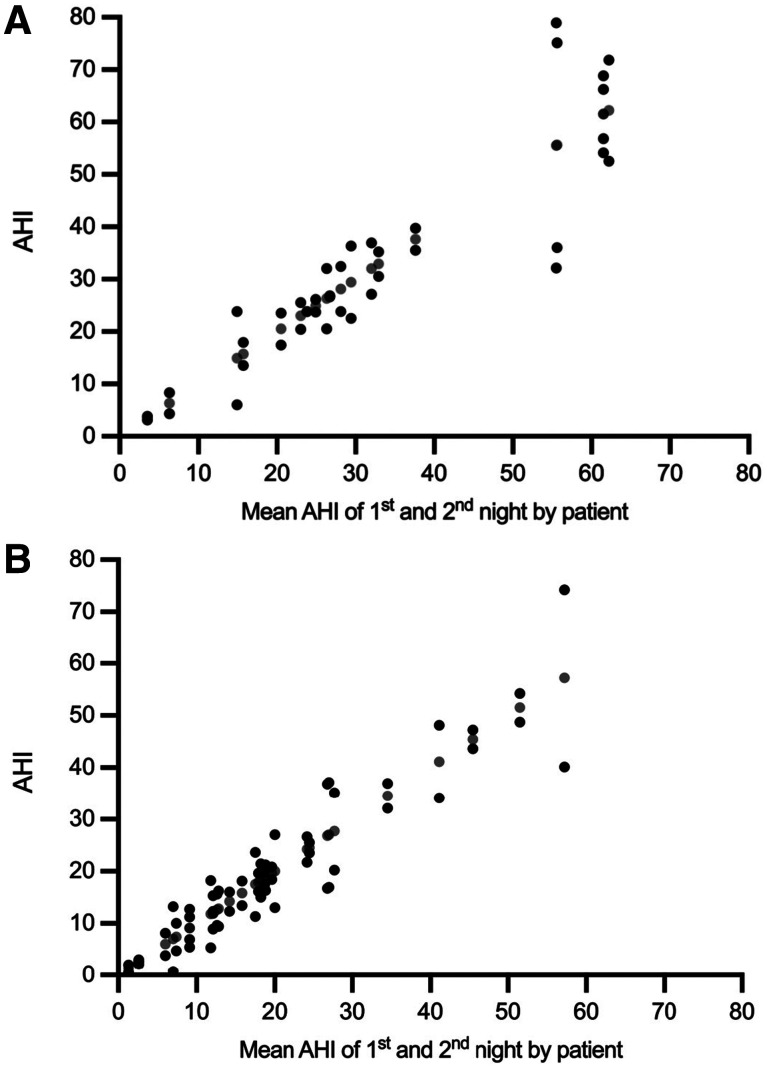
Figure 3. NNV in HSAT-PAT at baseline and after 1 year per patient.
(A) NNV in HSAT-PAT at baseline. (B) NNV in HSAT-PAT after 1 year. Black dots show the AHI values during each night, and gray dots indicate the corresponding mean of the 2 nights. Data for 2 nights are available for 20 patients at baseline and 32 patients after 1 year. The residual patients had HSAT-PAT for 1 night only and NNV could not be shown. AHI = apnea-hypopnea index, HST-PAT = home sleep apnea testing with peripheral arterial tonometry, NNV = night-to-night variability.

