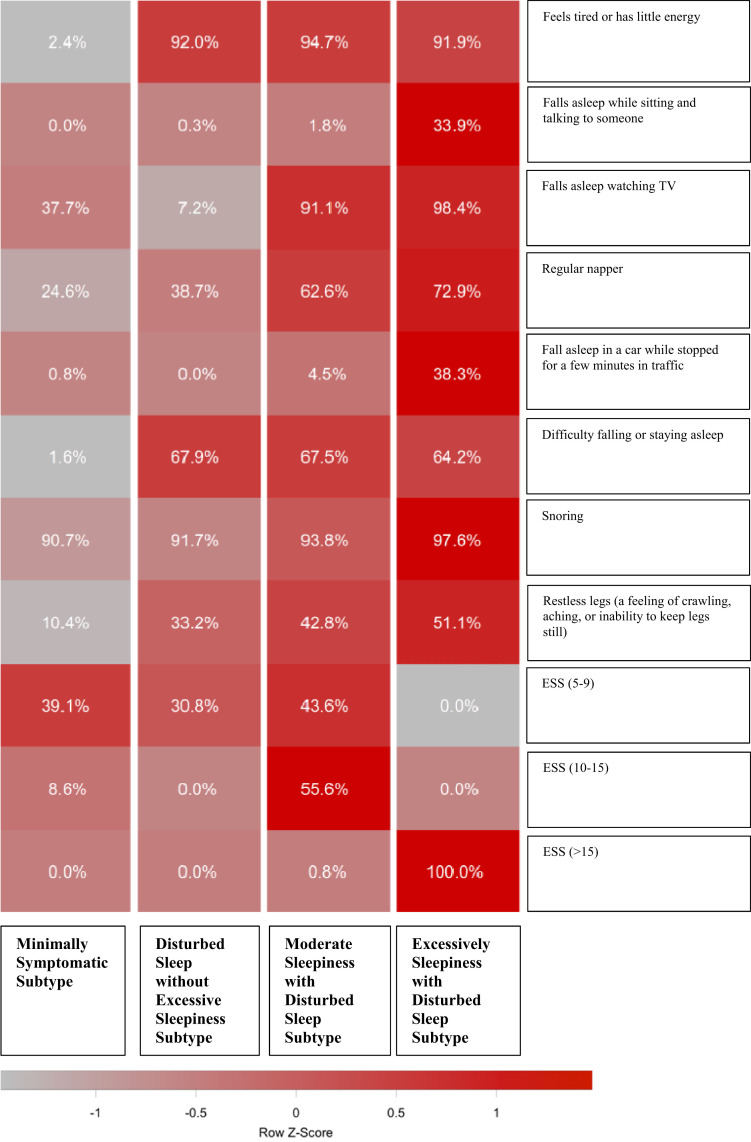
Figure 1. Symptom profile of the identified obstructive sleep apnea symptom subtypes in the UBC Sleep Clinic Cohort.
The relative differences in symptom burden among subtypes are shown by the color scale, which represents the standardized (z-score) symptom proportion or ESS severity category across groups. Brighter red indicates higher relative symptom burden. ESS = Epworth Sleepiness Scale, UBC = University of British Columbia.

