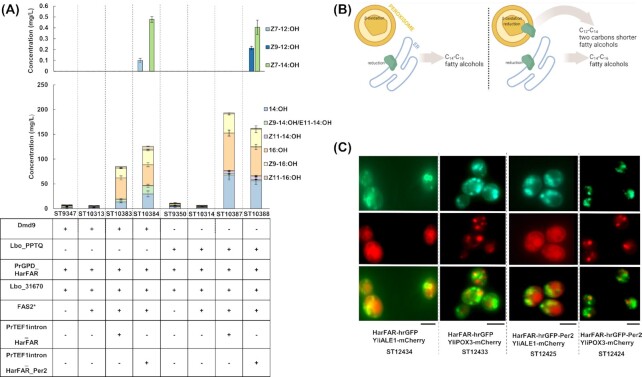
Figure 4.
Production of Z7-12:OH, Z9-12:OH, and Z7-14:OH via peroxisomal targeting of HarFAR. (A) Fatty alcohol profiles of engineered Y. lipolytica strains. “−” and “+” indicate absence or presence of corresponding genetic change. In the strains expressing Dmd9, Z9-14:OH/E11-14:OH consists only of Z9-14:OH. Cultivation media was supplemented with 0.4% (v/v) of 14:Me. Error bars represent standard deviations from three technical replicates. (B) Schematic representation indicating coupling of β-oxidation and reduction by redirection of HarFAR (green) to peroxisomes. (C) Fluorescence microscopy images of strains coexpressing HarFAR fusion proteins (top row, green) and ER and peroxisomal markers (middle row, red). Bottom row shows overlay between the two images. Scale bars below the images correspond to 5 µm. FAS2*: modified α chain of fatty acid synthase (Fas2pI1220F).

