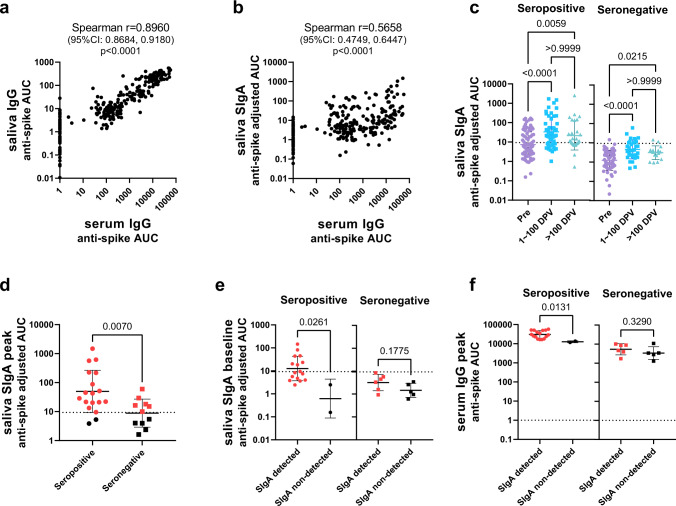
Fig. 2. Mucosal SIgA antibody response to vaccination in adult participants with or without previous SARS-CoV-2 infection.
a, b Correlation between anti-spike serum IgG antibody titers and saliva IgG antibody titers (a) or mucosal SIgA antibody titers (b) of samples collected from both seropositive and seronegative individuals at all time points. A total of 264 data points (6–13 data points per individual) were plotted for each panel. X and Y-axis values represent antibody titers (AUC: area under the curve). Spearman correlation coefficient and p values (two-tailed) are labeled above graphs. c Comparison of anti-SARS-CoV-2 spike SIgA titers in saliva between samples collected during different timepoints: before first vaccination (Pre, 91 samples in seropositive group and 62 samples in seronegative group), 1–100 days post first vaccination (1–100 DPV, 50 samples in seropositive group and 32 samples in seronegative group), and over 100 days post first vaccination (>100 DPV, 28 samples in seropositive group and 16 samples in seronegative group). Antibody titers (adjusted AUC) are plotted for each group. (statistical test: one-way ANOVA with Kruskal–Wallis test, p values above brackets). d Comparison of peak anti-SARS-CoV-2 spike mucosal SIgA titers between seropositive and seronegative individuals. The highest anti-spike SIgA titer among all timepoints (the peak saliva SIgA adjusted AUC) was plotted per individual (18 in the seropositive group and 11 in the seronegative group). Red dots (16 in the seropositive group and 6 in the seronegative group) indicate individuals with peak SIgA titers above the cut-off value (SIgA detected). e Comparison of baseline pre-vaccination anti-SARS-CoV-2 spikes SIgA titers in saliva between SIgA detected (16 in seropositive group and 6 in seronegative group) and SIgA non-detected (2 in seropositive group and 5 in seronegative group) seropositive and seronegative individuals. f Comparison of peak anti-SARS-CoV-2 spike IgG titers in serum of SIgA detected or SIgA non-detected seropositive and seronegative individuals. Mann–Whitney test was used in (d–f) (p-value (two-tailed) above bracket). All scatter plots in this figure are presented with geometric mean with geometric SD and a dotted line indicating the cut-off value (mean+3SD of the AUC of all samples collected from pre-vaccinated seronegative individuals). Source data are provided as a Source Data file.

