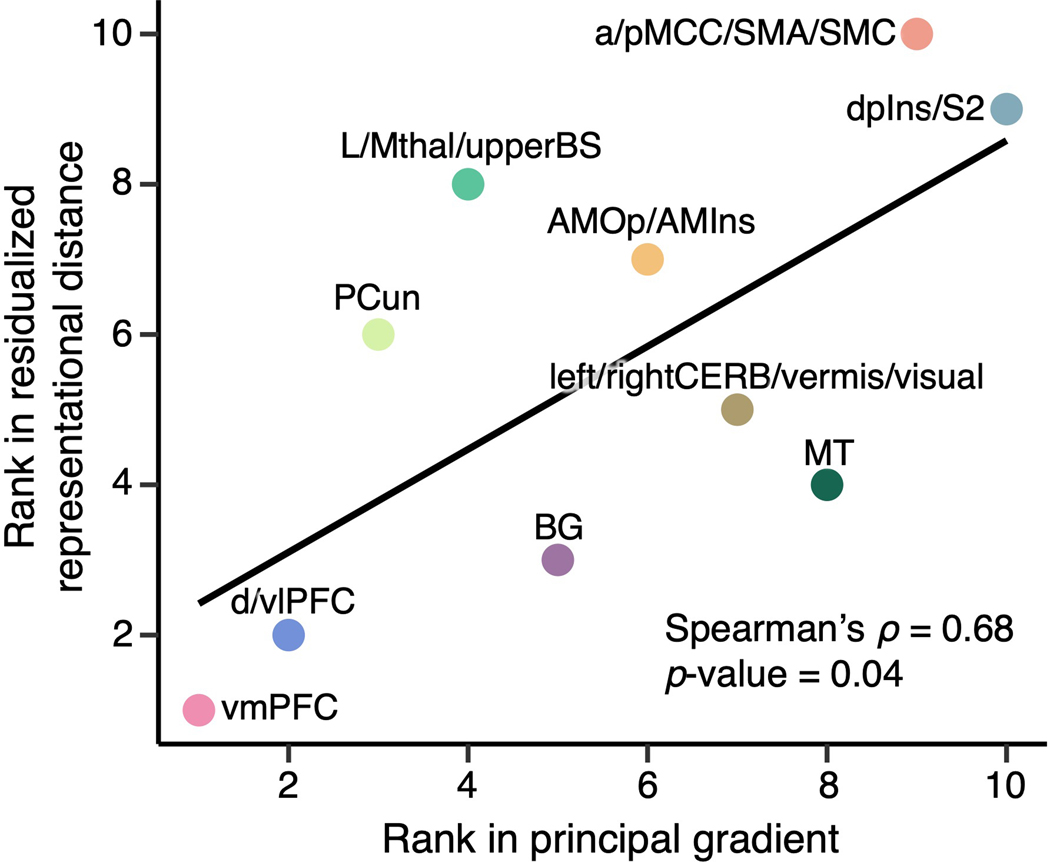
Extended Data Fig. 10. Relationship between the principal gradient of functional connectivity and mean residualized representational distance.
To compare the principal gradient spectrum and mean residualized distance in clusters, we first calculated the principal gradient map using our own resting-state fMRI dataset (n = 56; 7-min resting scan) to create a volumetric principal gradient image and to include the subcortical regions. We assigned ranks to the region clusters based on both the principal gradient value (x-axis) and mean residualized distance (y-axis) and compared them using Spearman’s rank correlation coefficient. We found a significant relationship at Spearman’s ρ = 0.68, p = 0.04, two-tailed.

