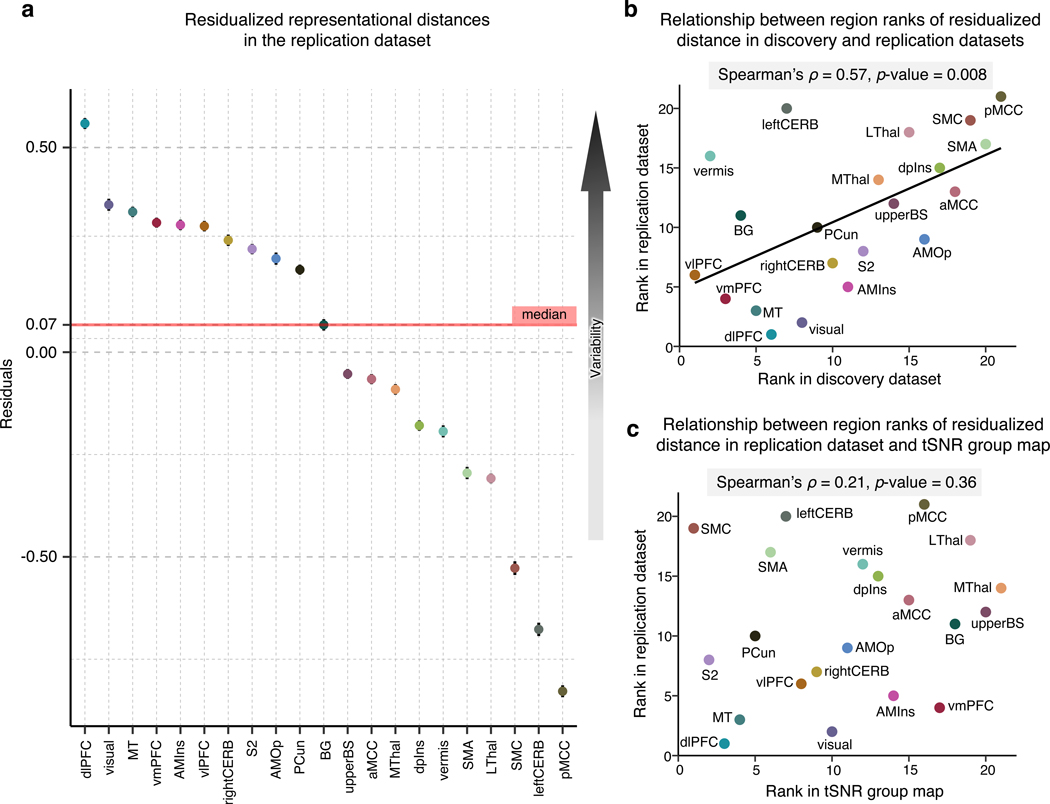
Figure 4. Replication of the multivariate representational similarity analysis in an independent dataset and tSNR in the dataset.
To validate the previous results, we employed an independent replication dataset acquired under the same experimental settings in the same location. (a) In the replication dataset, we performed a representational similarity analysis and regressed out the effects of region size on the mean representational distance. The plot depicts the residualized representational distance (a measure of inter-individual variability in neural patterns) in each region, with higher values representing higher regional variability. (b) Based on the residualized distance, we assigned ranks to all regions in both the discovery and replication datasets. The scatterplot visualizes the statistically significant relationship between the results in the two datasets. (c) To further inspect whether our results in the replication dataset are influenced by a different tSNR in different regions, we calculated the mean tSNR in all regions. The scatter plot compares the region ranks based on the tSNR and residualized representational distance suggesting that the regional variability in the replication dataset cannot be explained by varying tSNR in regions.

