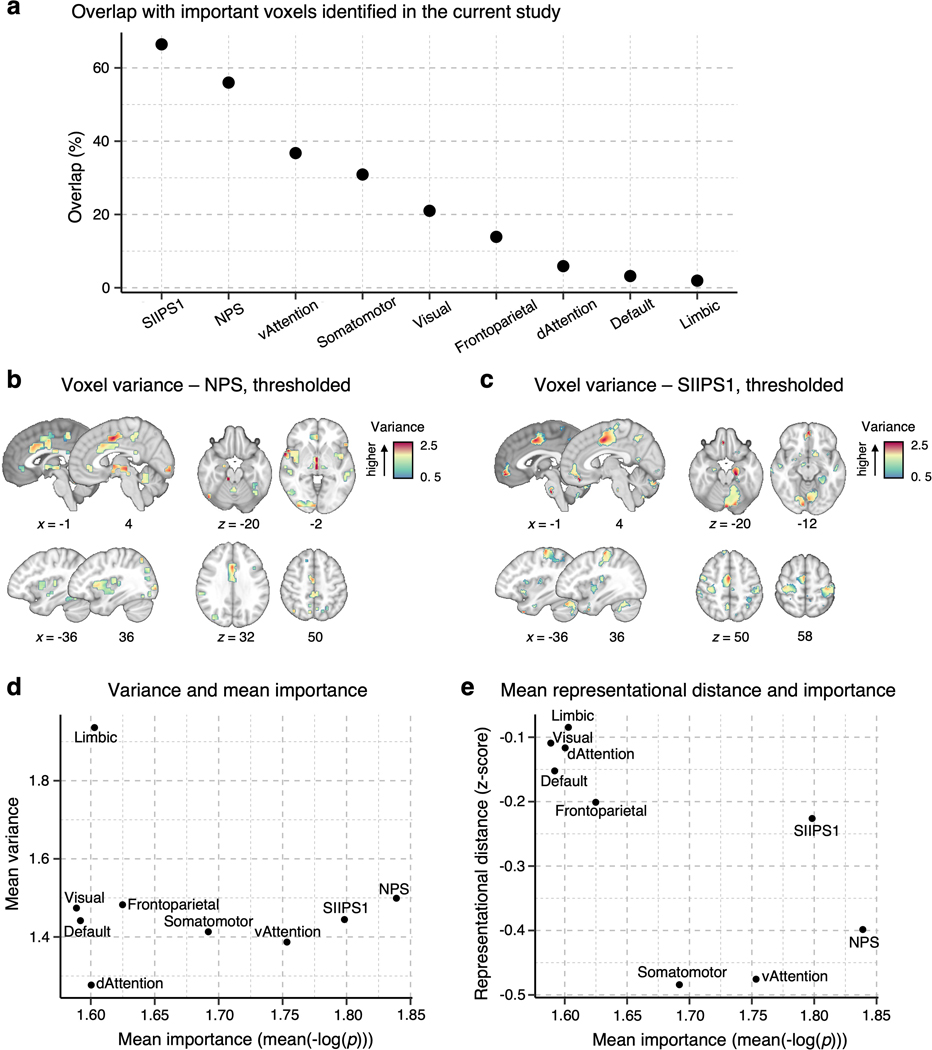
Extended Data Fig. 1. Reference results based on pain signatures and large-scale functional networks.
To provide a reference to other commonly used brain parcellations and existing pain signatures, we performed the analyses presented in the manuscript with the NPS1, SIIPS12 (thresholded at q < 0.05, false discovery rate [FDR] correction), and seven large-scale resting-state functional networks3 as masks. (a) The plot shows the proportions of the overlapping voxels of the pain signature and network masks with the area of the important voxels identified in the current study. (b) and (c) show the voxel-wise variance across the individuals from the discovery dataset in the thresholded NPS and SIIPS1 masks, respectively. (d) In each signature and network mask, we calculated the mean importance with mean(-log(p)) (based on two-tailed p-values) and the mean voxel-wise variance. The results suggest that the limbic network showed the highest mean variance, while the dorsal attention network showed the lowest mean variance (e) We also performed the multivariate analysis. we calculated the inter-individual representational dissimilarity matrix (RDM) using the correlation-based distance for each masked area, performed the permutation tests with 1,000 samples, as we did in the main analyses, and calculated the normalized RDMs (z-scores), as we did in the main analysis (see Fig. 3a in the main manuscript). The results suggest that the limbic and visual networks showed the highest mean normalized representational distance (i.e., highest inter-individual variability), while the somatomotor and ventral attention networks showed the lowest distance (i.e., lower inter-individual variability). dAttention, dorsal attention network; vAttention, ventral attention network

