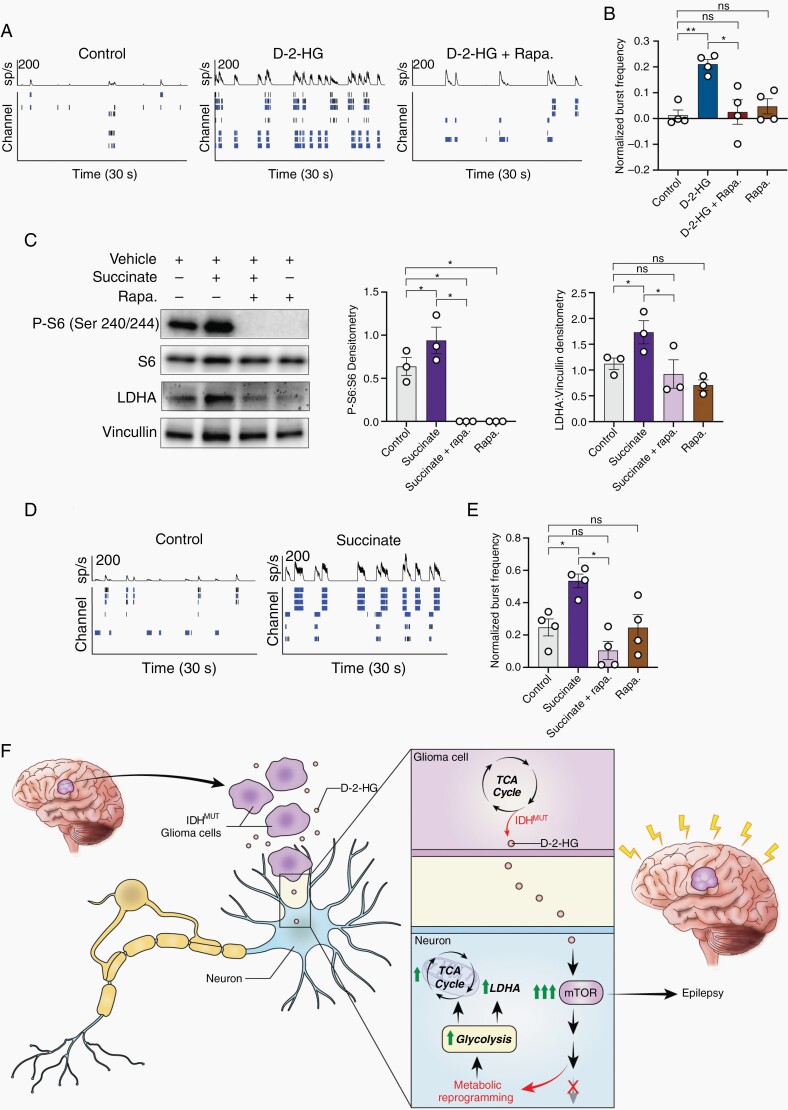
Fig. 6.
Metabolites d-2-HG and succinate causes neuronal hyperexcitability in an mTOR-dependent manner. A) Spike histogram and raster plot of control (left), d-2-HG (middle), and d-2-HG and rapamycin (left) treated cortical rat neurons. B) Normalized burst frequency of cortical rat Fig. 6 (Continued) neurons treated with control (PBS), d-2-HG, d-2-HG and rapamycin, and rapamycin. d-2-HG treated neurons significantly increase normalized burst frequency compared to control (n = 4, t(3) = 6.942, P = .0061, paired t test) and d-2-HG + Rapa. (n = 4, t(3) = 4.574, P = .0196, paired t test). Additionally, d-2-HG and rapamycin treated neurons have similar normalized burst frequency compared to control (n = 4, t(3) = 0.3735, P = .7336, paired t test). Rapamycin alone does not significantly decrease normalized burst frequency compared to control (n = 4, t(3) = 1.249, P = .3004, paired t test). (C) Succinate significantly upregulates P-S6:S6 (n = 3, control vs Succinate, t(2) = 5.393, P = .0327, paired t test), surrogate marker for mTOR signaling. This increase is inhibited with rapamycin (n = 3; control vs Succinate + rapa., t(2) = 6.109, P = .0258, paired t test; Succinate vs Succinate + rapa., t(2) = 6.094, P = .0259; control vs rapa., t(2) = 6.109, P = .0258, paired t test). Succinate also increases LDHA protein expression (n = 3, control vs Succinate, t(2) = 4.386, P = .0482, paired t test), which is corrected with rapamycin to control levels (n = 3,control vs Succinate + rapa., t(2) = 0.8713, P = .4754, paired t test; Succinate vs Succinate + rapa., t(2) = 6.920, P = .0202, paired t test; control vs rapa., t(2) = 2.893, P = .1016, paired t test). (D) An example spike raster demonstrating that treatment with succinate results in increased bursting activity compared to control. (E) Across cultures, succinate increases normalized burst frequency compared to control following 7-day treatment (n = 4, t(3) = 3.475, P = .0402, paired t test). This increase is corrected to control levels with co-treatment of rapamycin (n = 4; control vs Succinate + rapa., t(3) = 2.633, P = .0781, paired t test; Succinate vs Succinate + rapa., t(3) = 4.755, P = .0177, paired t test; control vs rapa., t(3) = 0.01238, P = .9909, paired t test). (F) Proposed mechanism: IDH-mutated gliomas produce d-2-HG, which is released into the peritumoral environment. d-2-HG upregulates mTOR signaling in surrounding neurons, leading to metabolic reprogramming and epileptogenesis.

