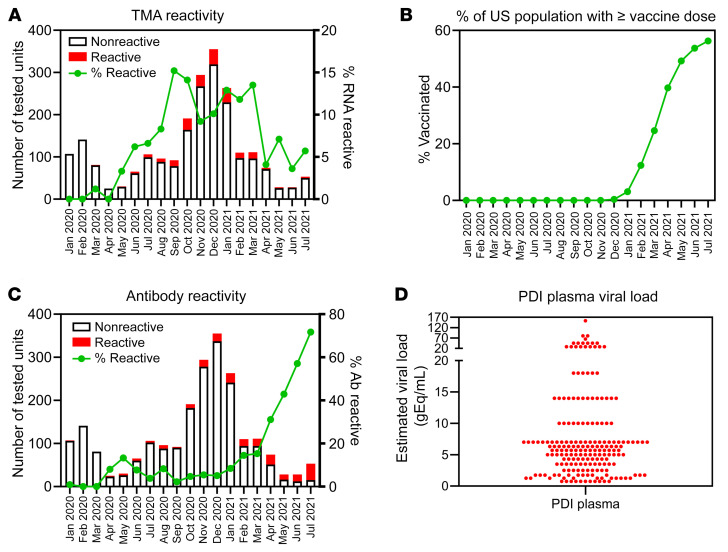
Figure 2. Detection of SARS-CoV-2 RNA and antibodies in PDI donors.
(A) Plasma samples (n = 2,250) were collected over the course of 19 months throughout the United States. Bars correspond to total number of donations tested for SARS-CoV-2 RNA per month of collection, with the red portion denoting those reactive. Line corresponds to percentage of RNA-reactive donations. (B) Data published on the CDC website (https://data.cdc.gov/Vaccinations/COVID-19-Vaccination-Trends-in-the-United-States-N/rh2h-3yt2) show the average proportion of the US population that had received at least 1 vaccine dose for each month of the period during which PDI plasmas were tested. (C) Plasma samples (n = 2,250) were collected over the course of 19 months throughout the United States. Bars correspond to total number of donations tested for SARS-CoV-2 spike antibodies per month of collection, with the red portion denoting those reactive. The green line corresponds to percentage of antibody-reactive donations. (D) Estimated viral load of SARS-CoV-2 RNA in 196 reactive plasma samples based on TMA reactivity in replicates normalized to a standard curve.

